12,000 UAP Sightings and Counting
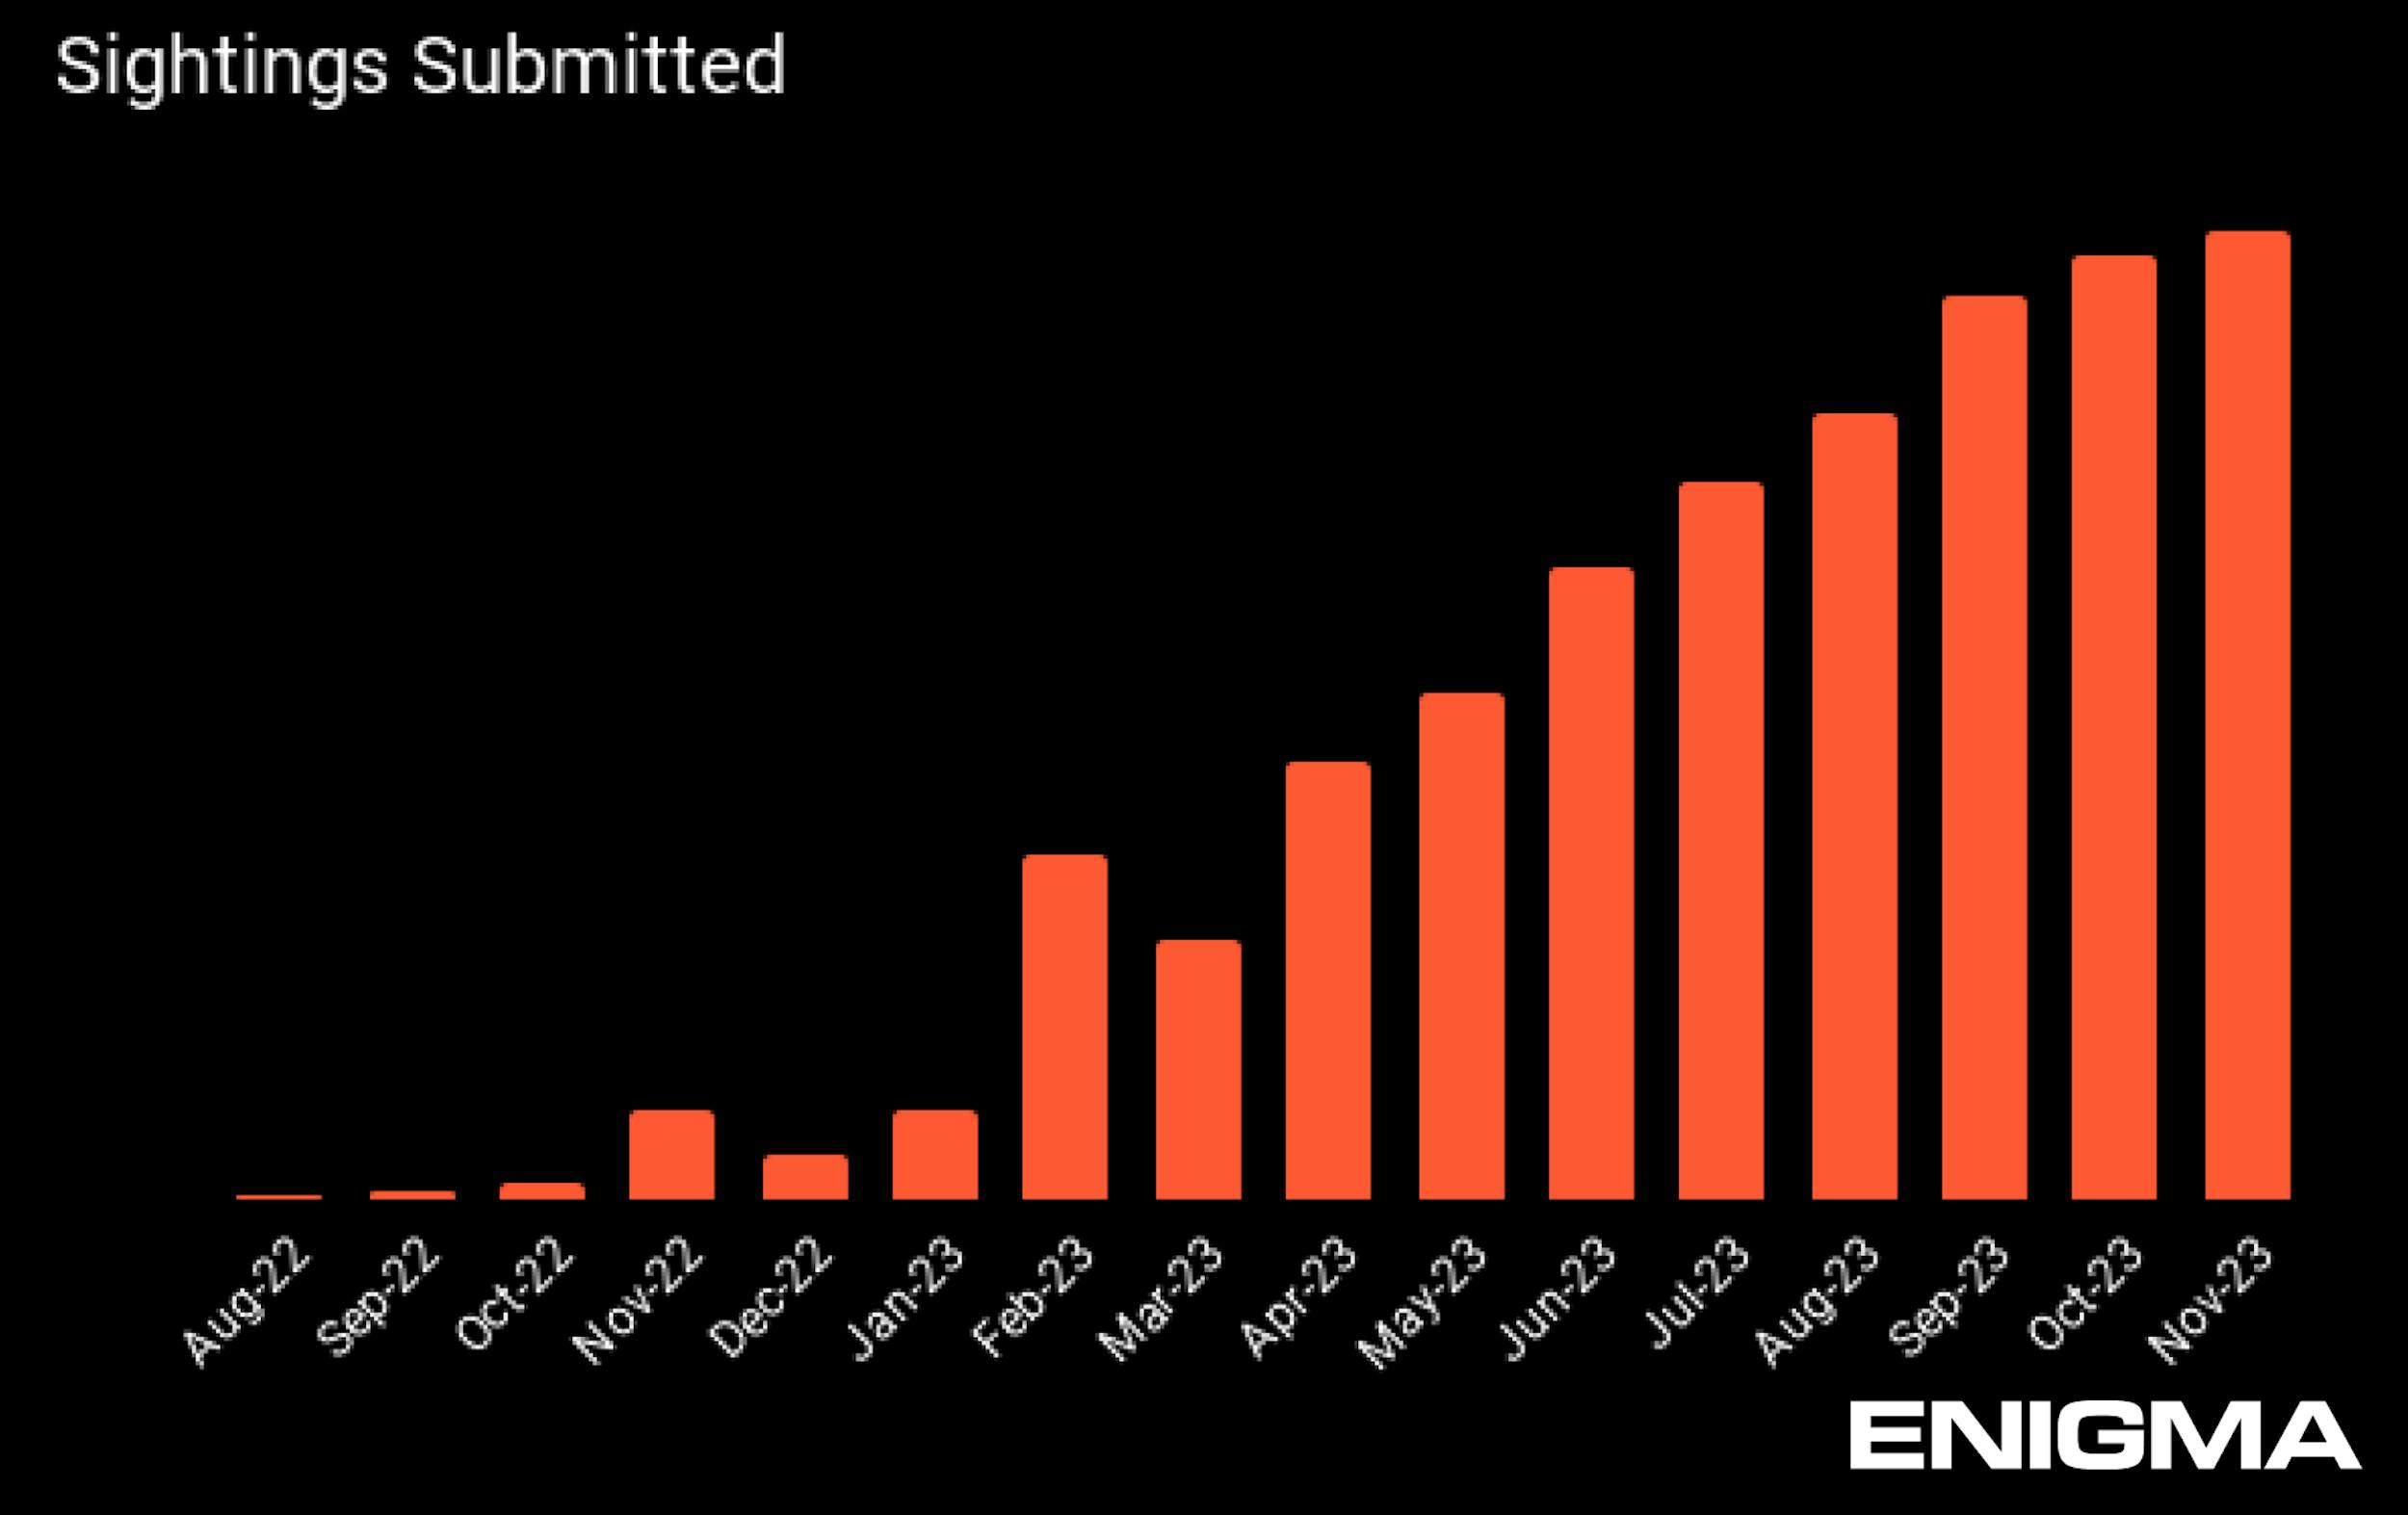
At Enigma, we are laser focused on how to reach and serve people who have seen things they can’t explain in the skies. Enigma is the easiest destination for people to report what they've seen. We strive to constantly improve our sighting submission process to make it smoother, easier to understand, and remove bugs. With these frequent improvements, as well as our increased online presence, the number of sightings submitted to us has grown rapidly month over month.
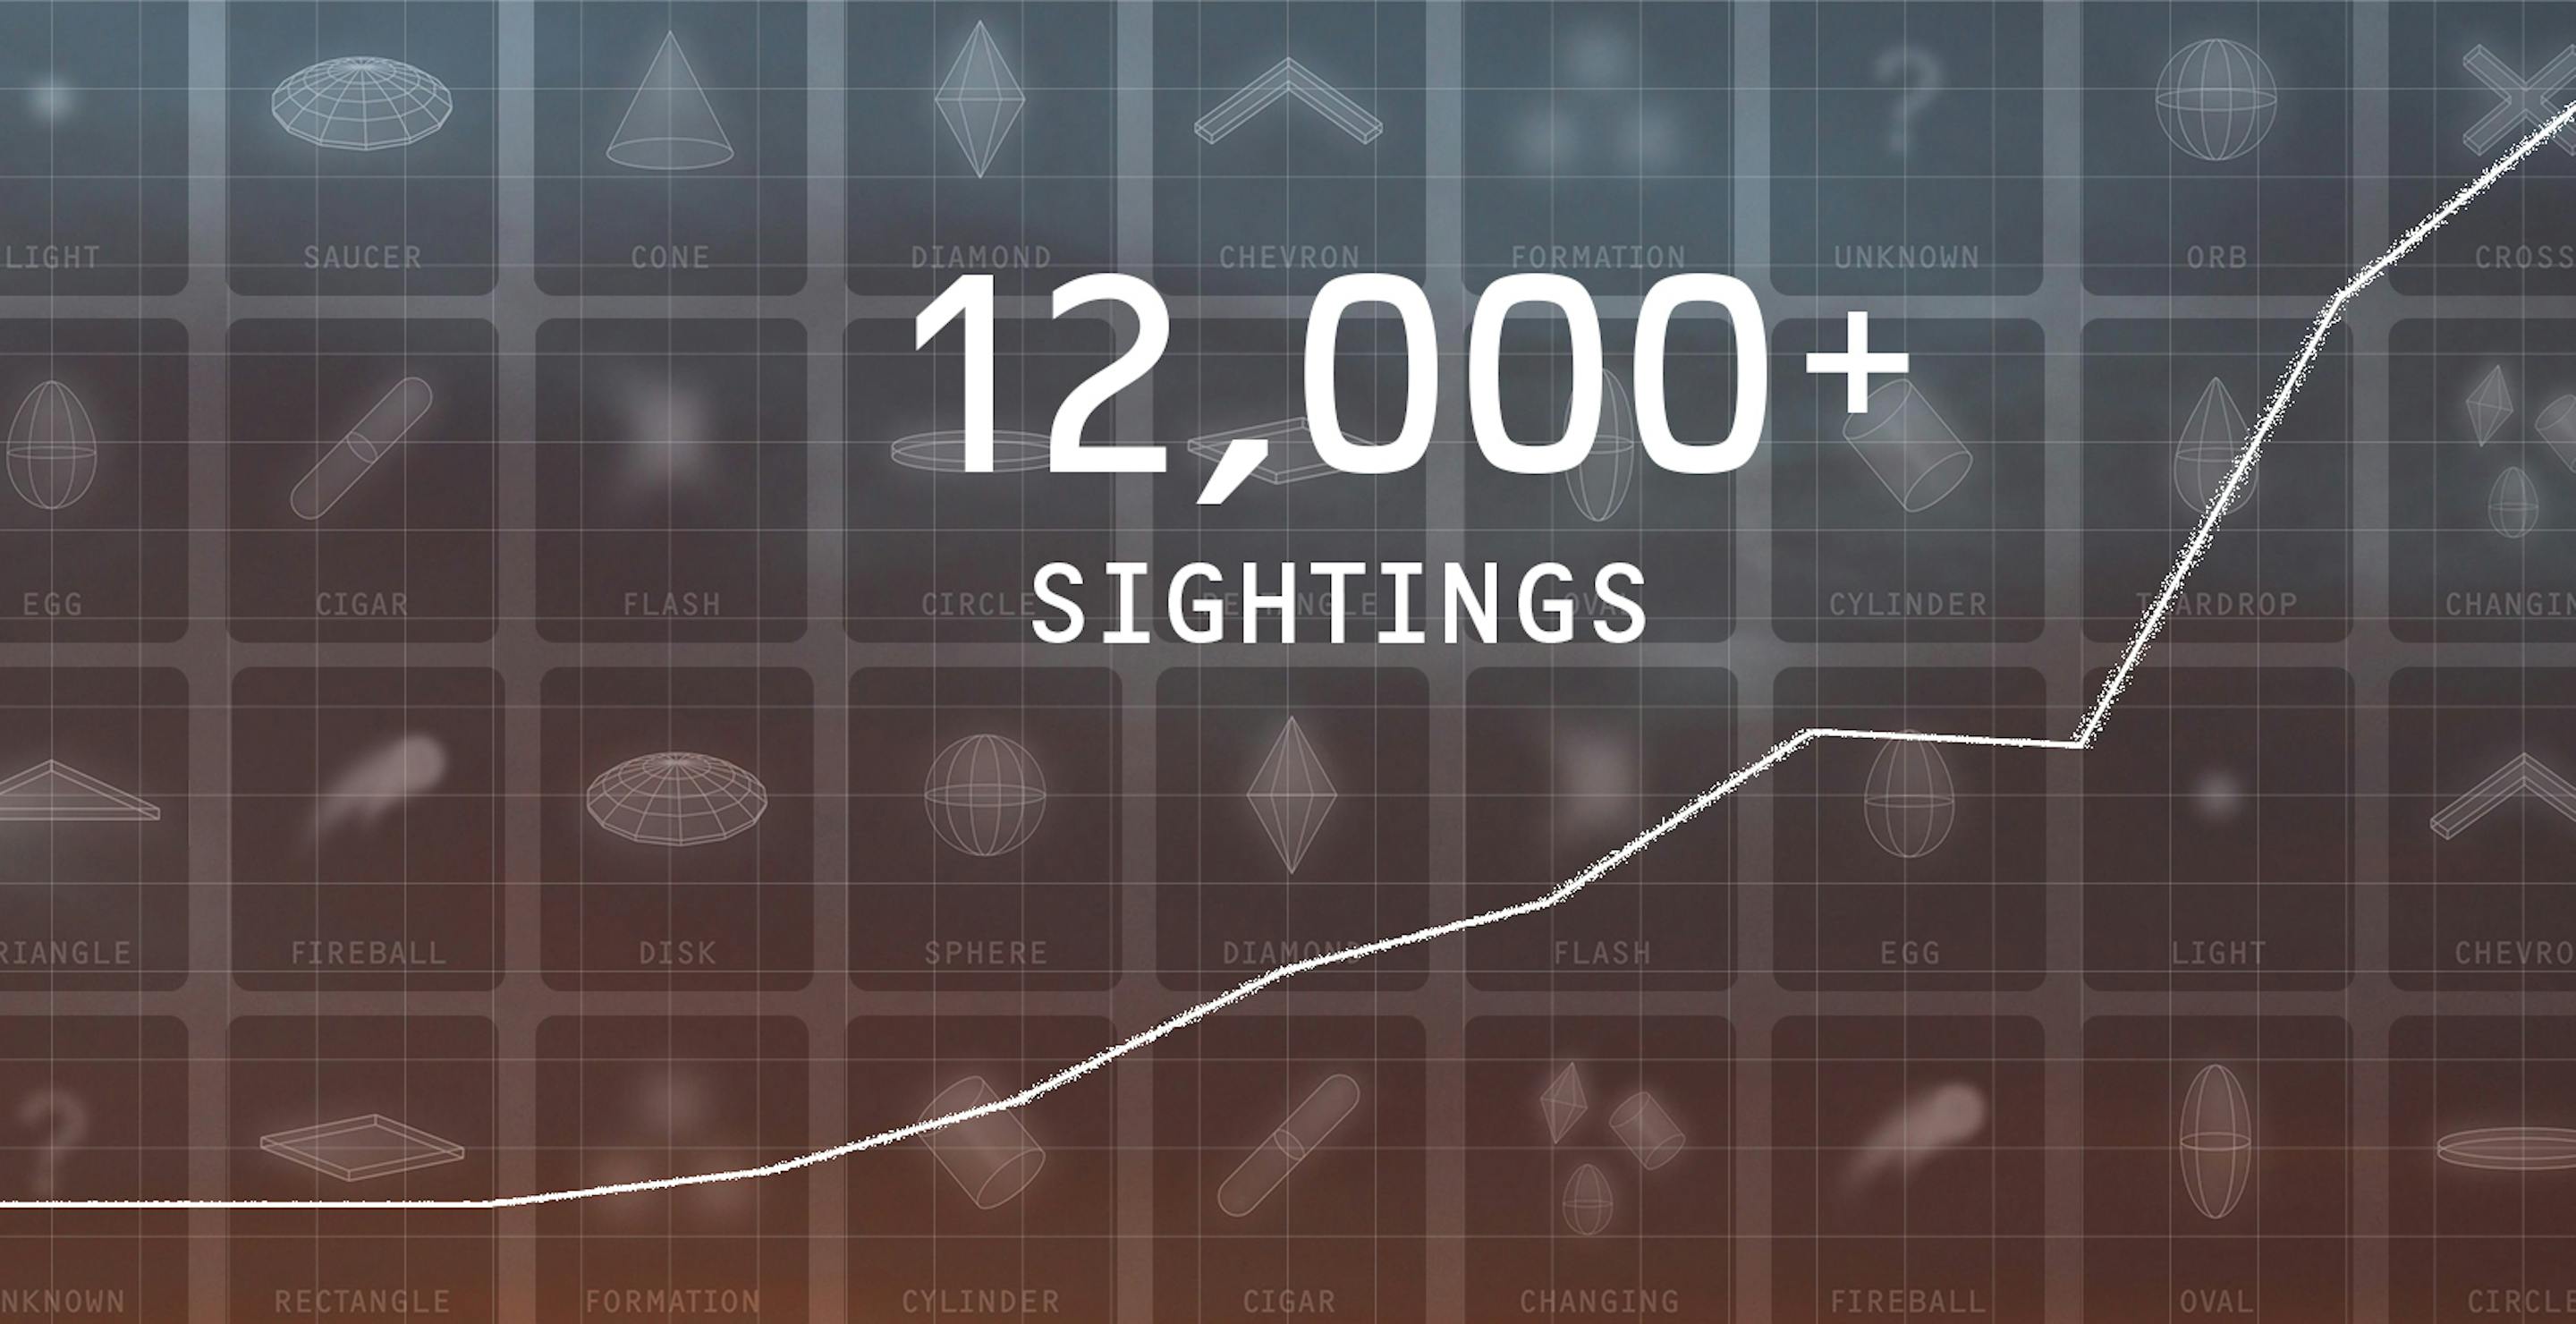
The team was excited to recently celebrate crossing 12,000 sightings submitted to and processed by Enigma. We are largely a team of engineers and data scientists, and we wanted to share some of our analysis with you on what we have learned from collecting over 12,000 sightings.
Two points of note:
- Note that only about half of the sightings submitted met our approval criteria, ie. had the required information we need to be published. Every sighting is reviewed carefully by a member of our team, and is also scored by an algorithm. Every sighting that is approved is published straight to our iOS app, which is live for users to freely explore. Sightings that are not approved are not published. The analysis below is based on all the 12k sightings submitted, not just the published cases.
- All of the data below is based on self-reporting by sighters. Enigma did not independently verify each sighting. That is to say, if the sighter said "it was a triangle shape," then we counted it as a triangle, (whether or not they submitted media showing a specific shape). If the sighter said they "detected the object on radar or night vision," then we counted it as sensor detection (they don’t have to submit the sensor data).
How people prefer to submit sightings
Today, there are two ways to submit a sighting to Enigma – via our website and our iOS app. Although we do receive emails from people sharing their stories, we redirect those folks to submit via web or iOS app, as we require structured information for it to be a complete sighting report, eg. date, time, location, shape, how anomalous the object was.
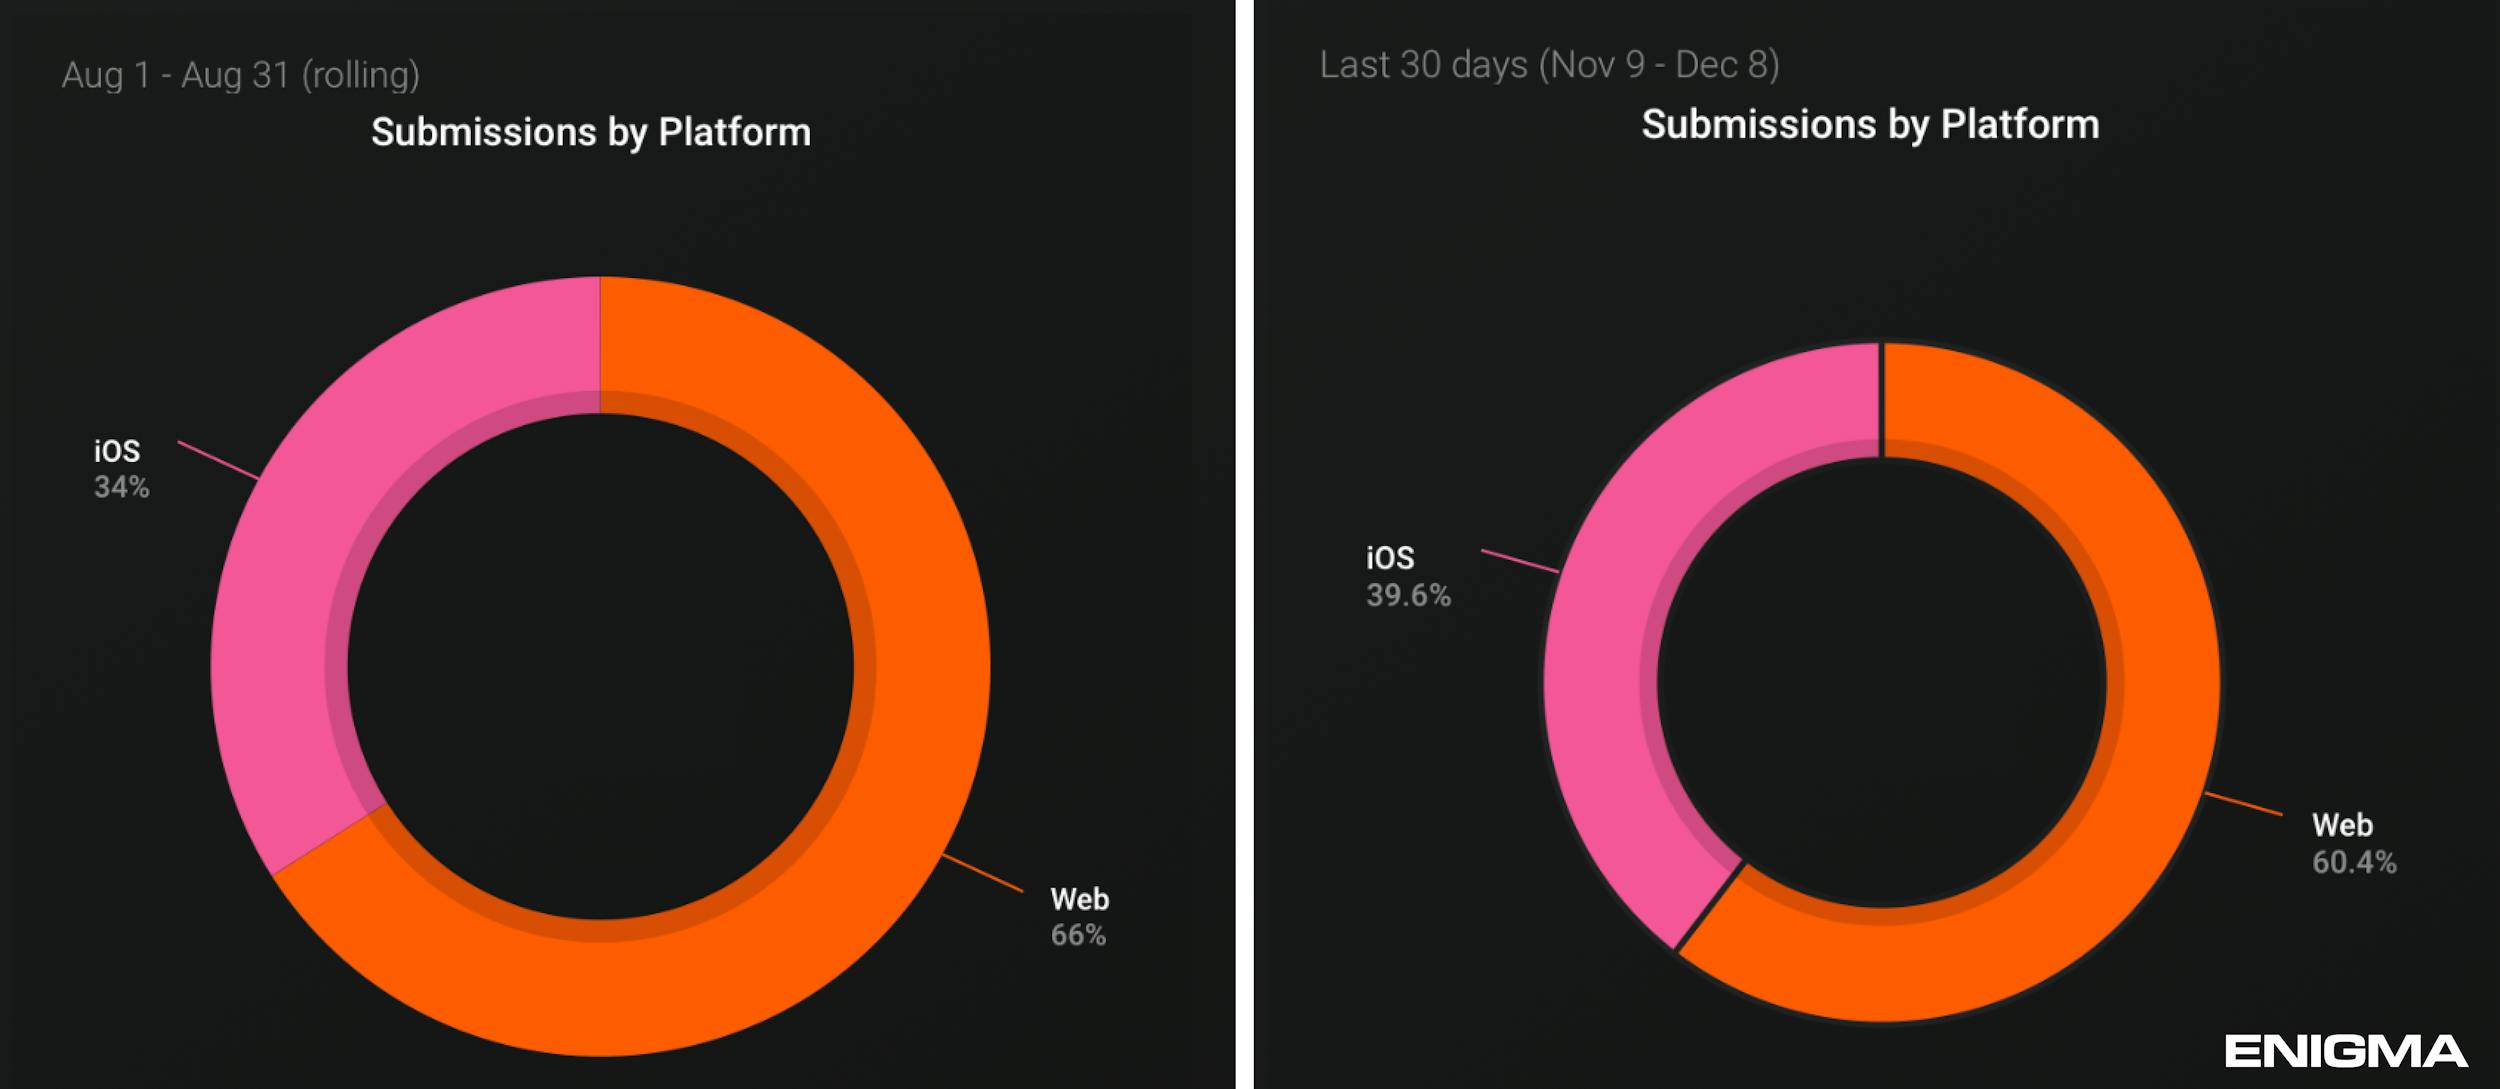
Web continues to be the dominant way that people find and submit sightings to us, but it is shrinking over time. Since our iOS app went live at the end of April, more people are discovering us via the app. People increasingly prefer to submit sightings to us on mobile. It is certainly easier for people to upload and submit media from their smartphone cameras directly through the app. We have had a lot of people asking for an Android app. We do plan to respond to that request and launch an Android app in 2024 to better serve people with other types of phones. Here is a side by side comparison of submissions in August compared to November, showing how many sightings were submitted on our website vs in the iOS app:
In-app sighting submissions
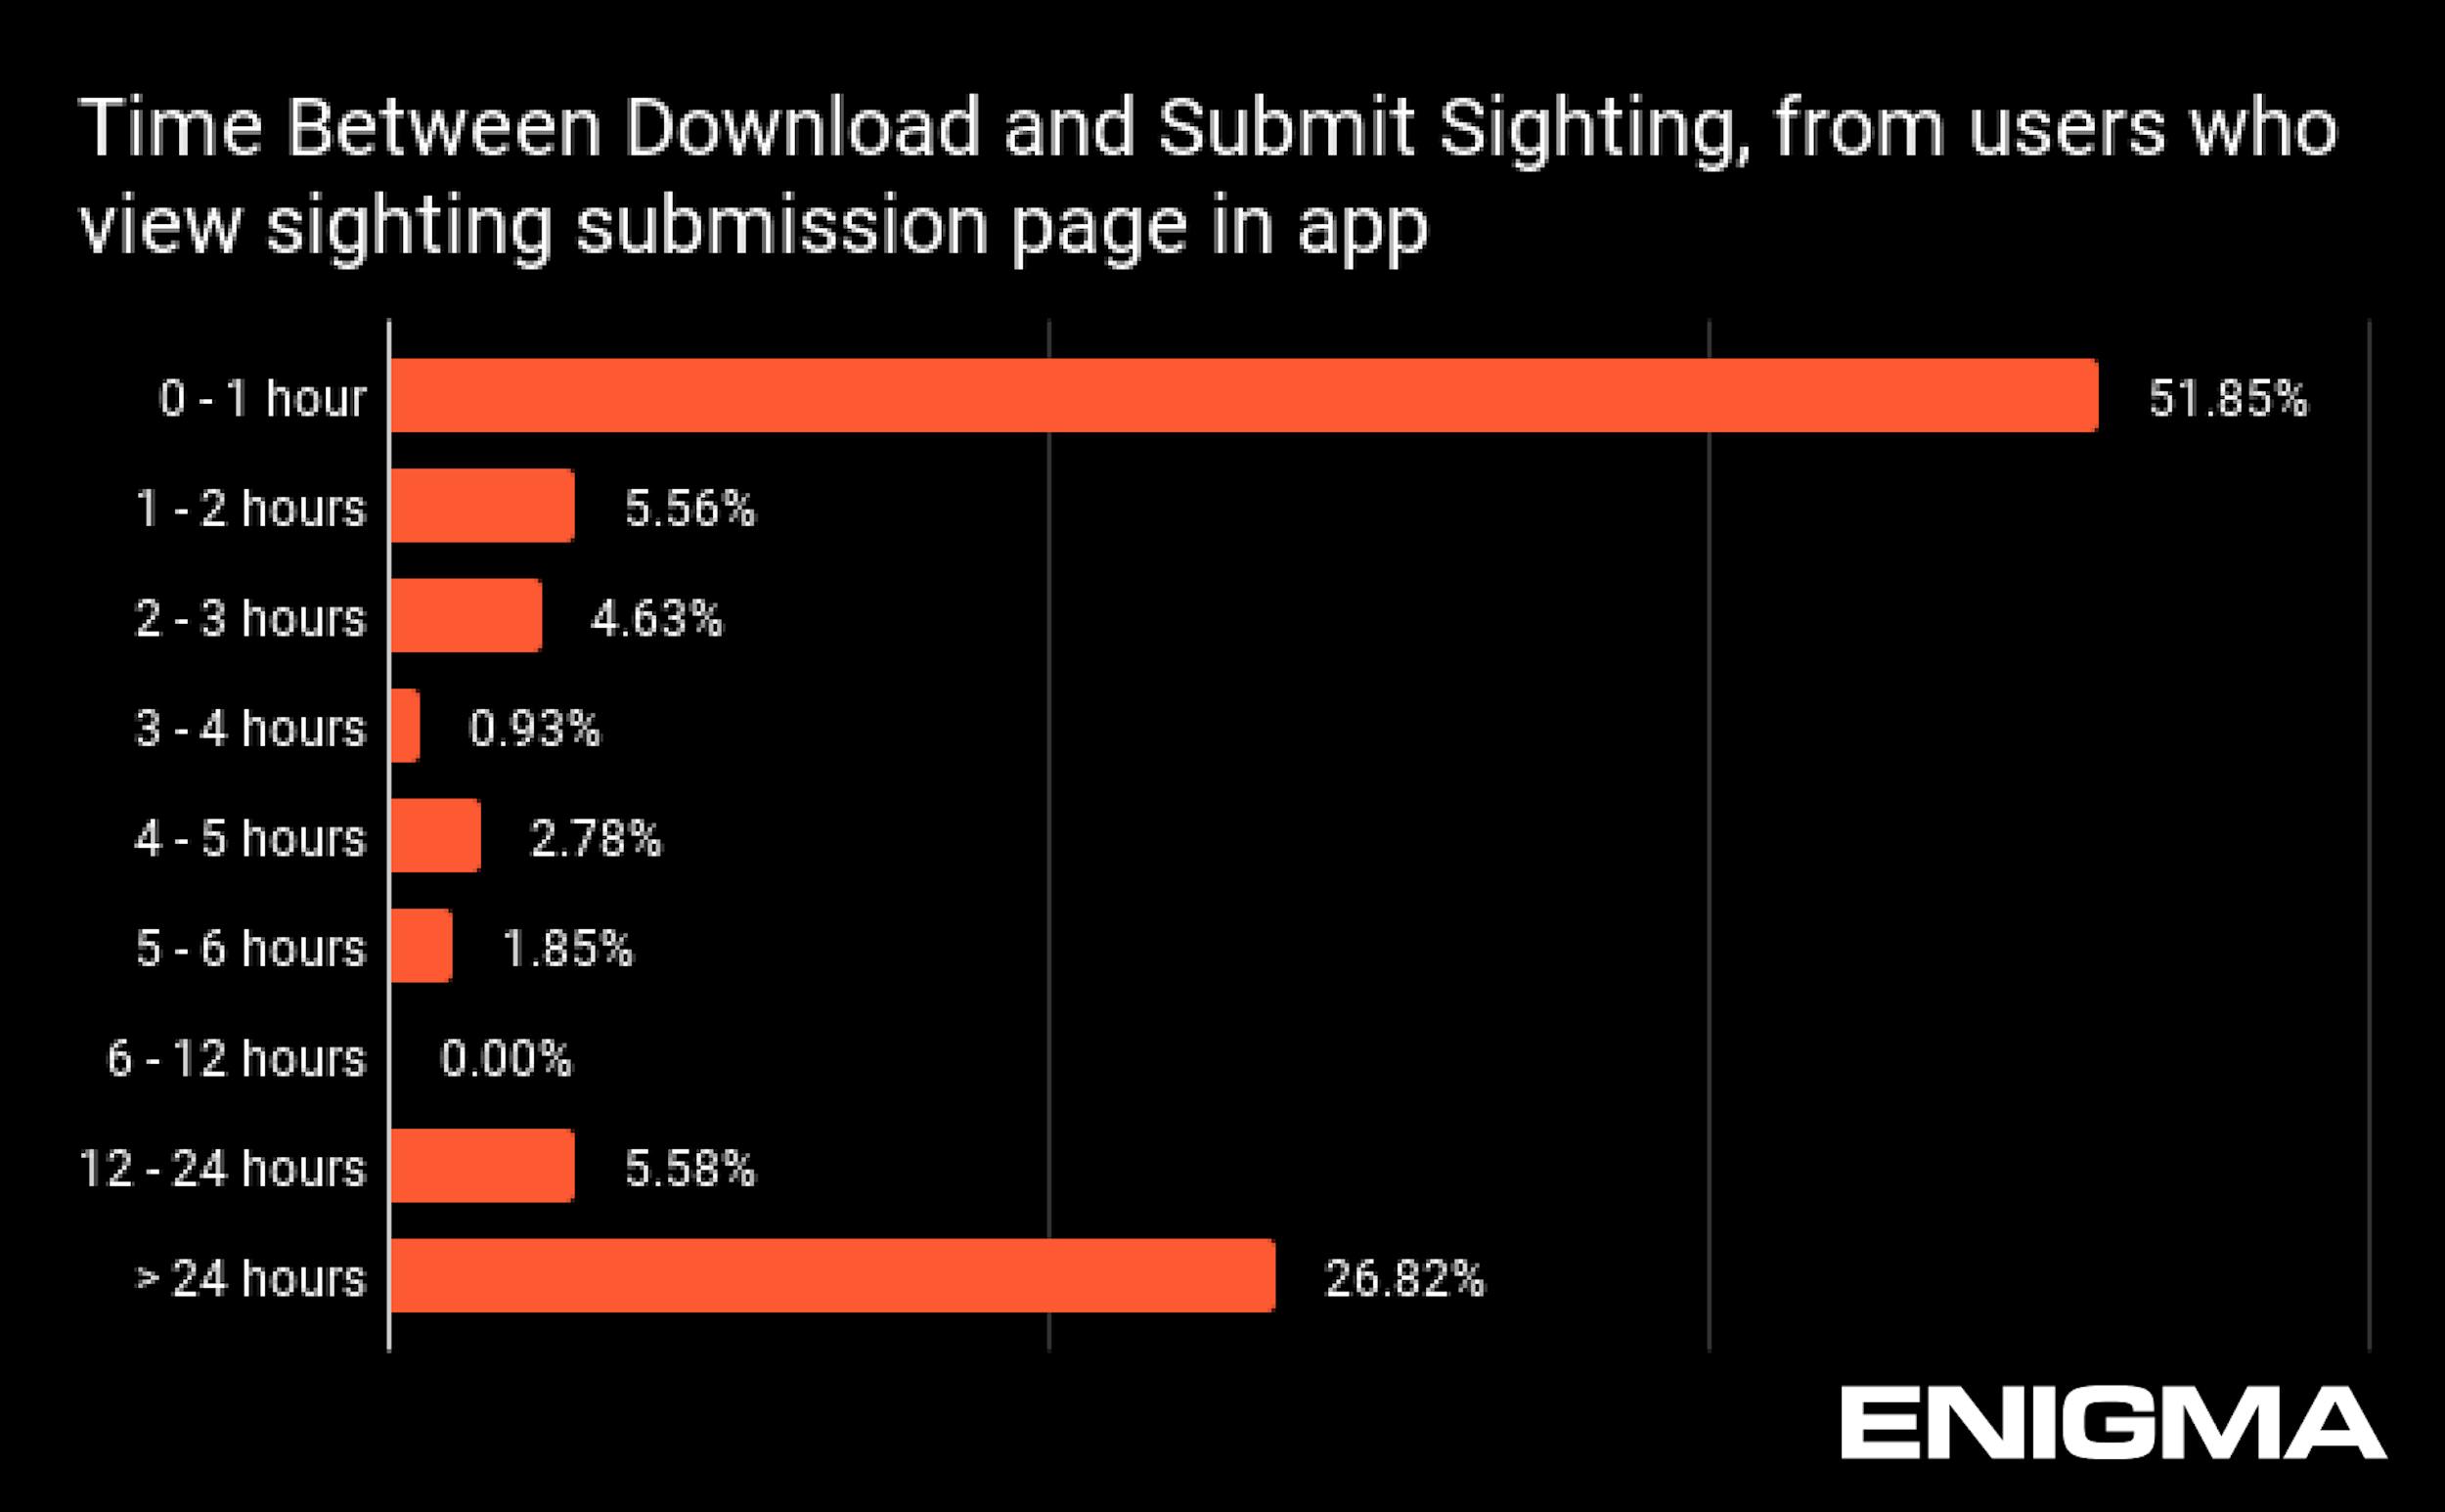
Of people who download our app and open the sightings submission tab (the fourth button at the bottom of the home screen), over half submit a sighting within the first hour of having the app. We were impressed to see this stat, which highlights just how important sharing sightings is to our users:
Sightings submitted – by country
Sightings have been submitted to Enigma from all across the globe – from a whopping total of 107 countries. We’ve received sightings from countries like Sri Lanka, El Salvador, Nigeria, Iraq, Morocco and Serbia. The top countries we’ve received sightings from are:
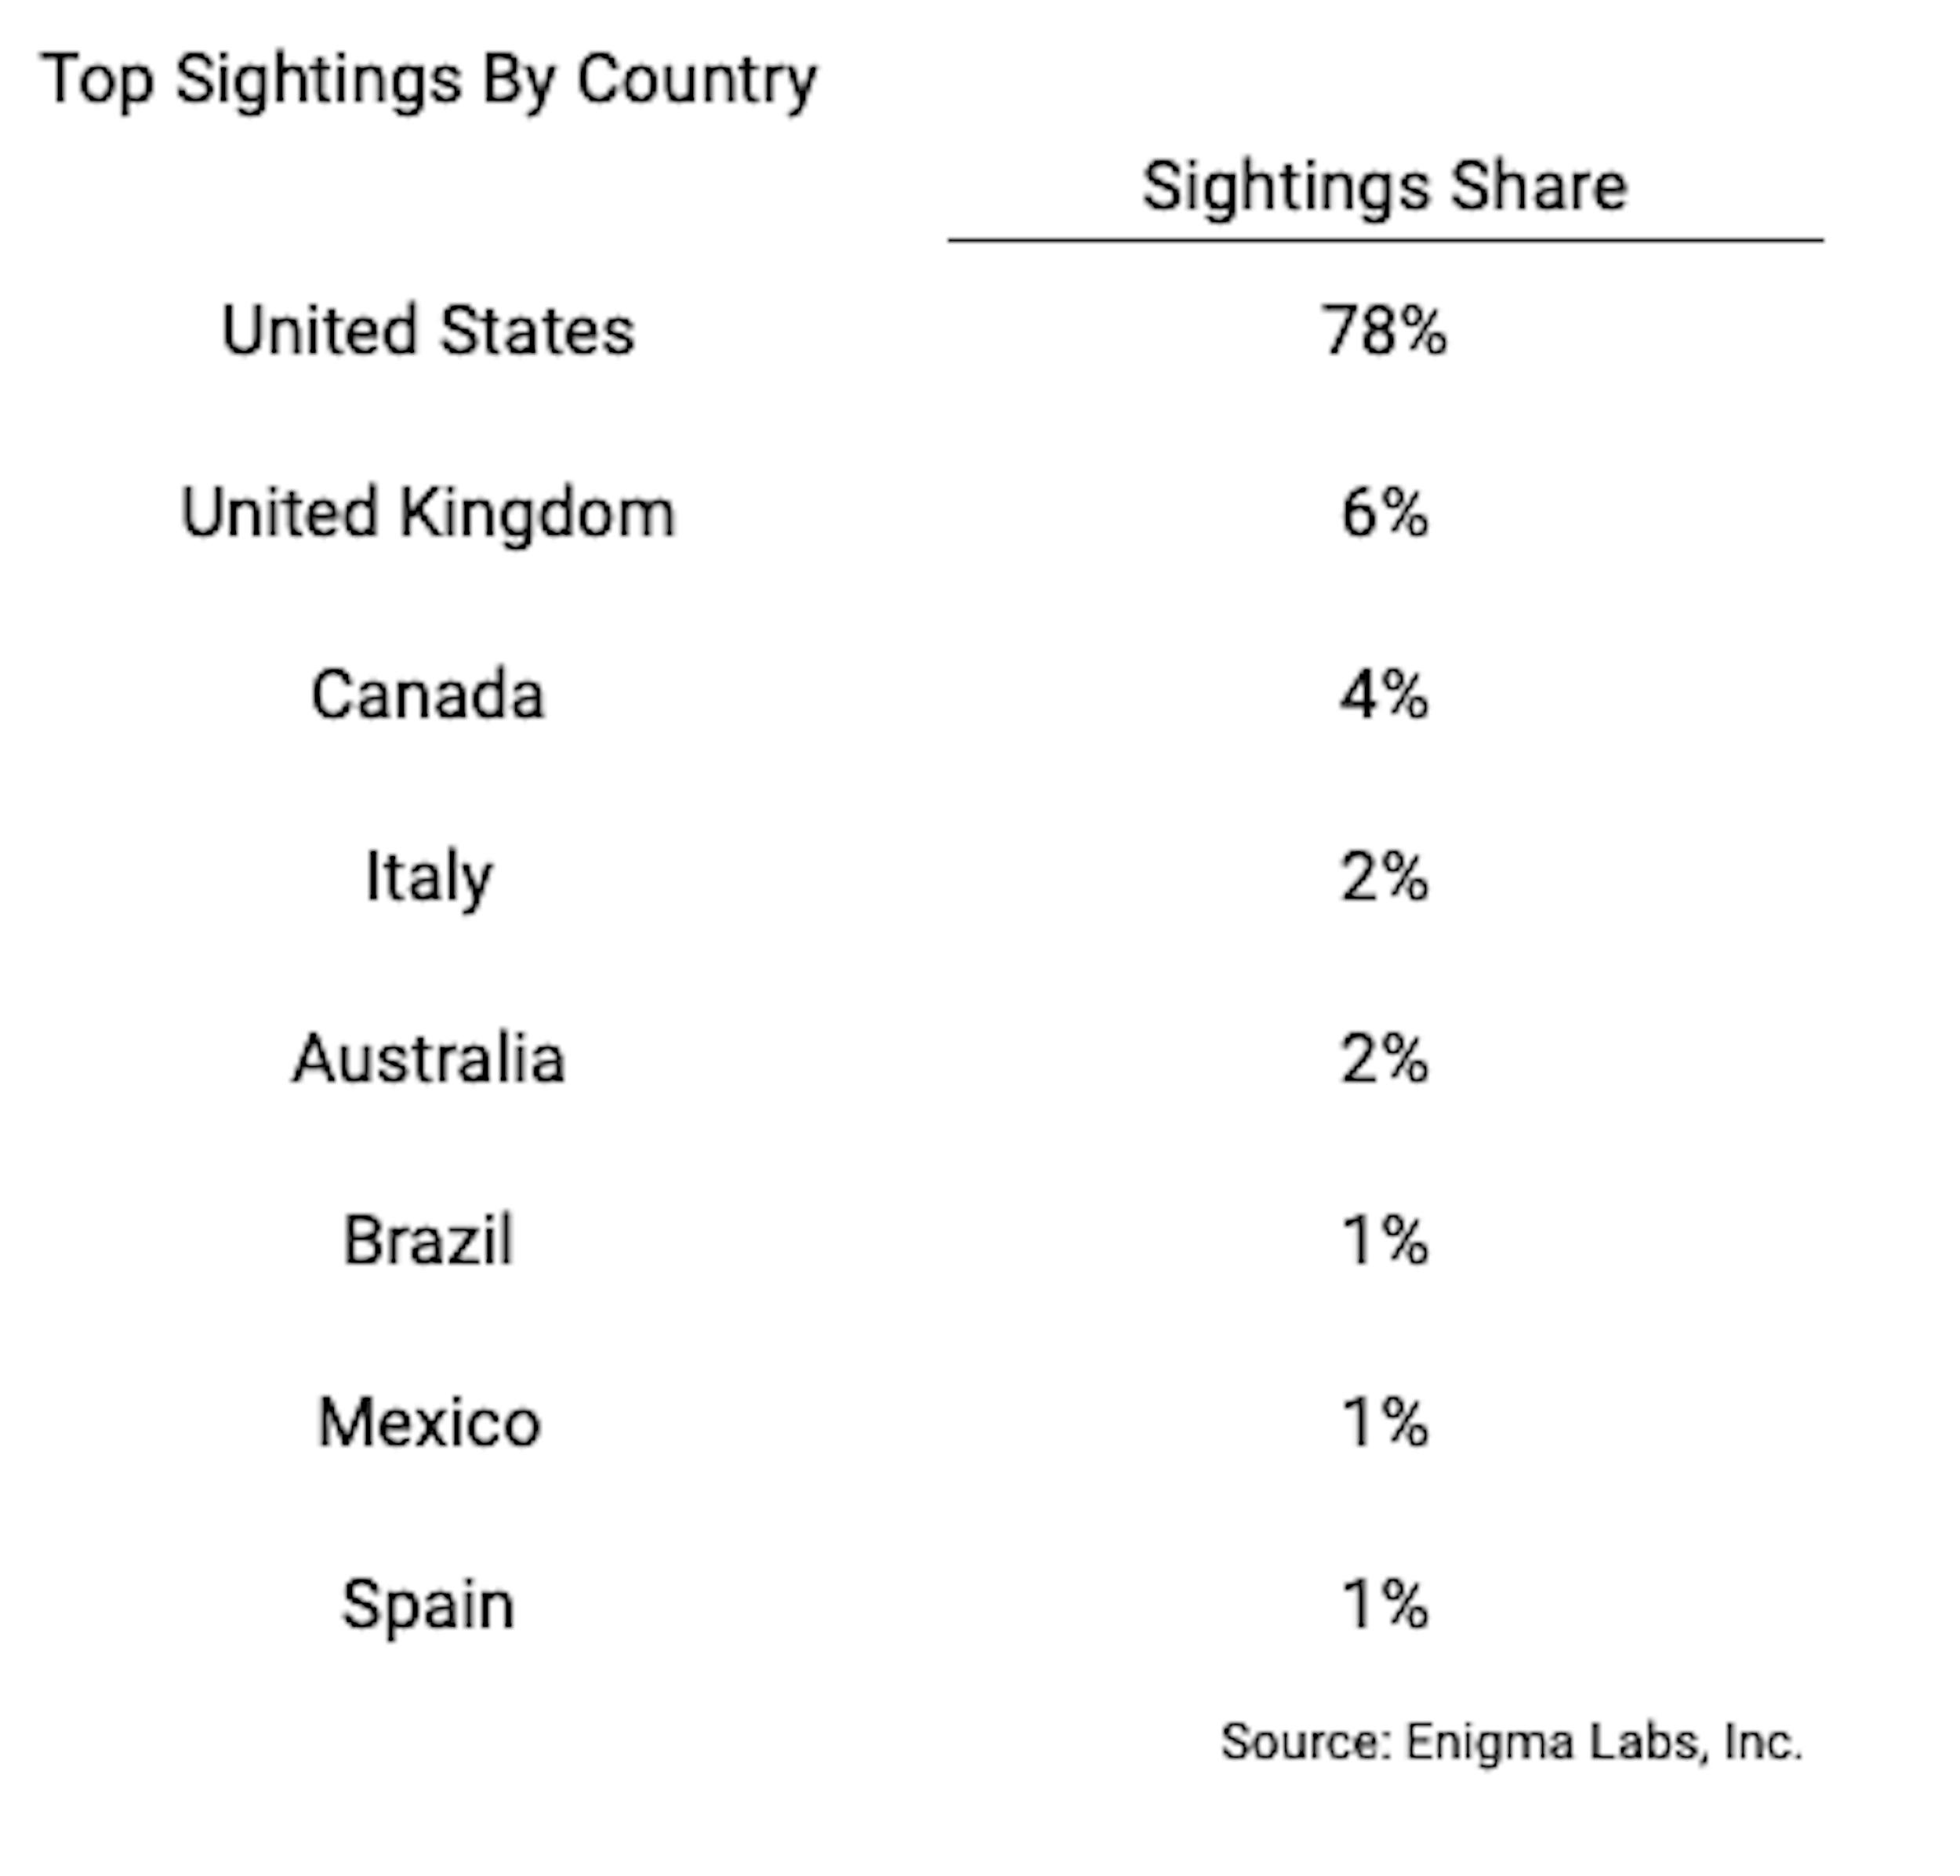
We are not surprised to see that the U.S. remains the country with the highest number of sightings submitted. This is in part because iOS penetration is higher in the U.S., whereas Android is more popular internationally, and Enigma is not on Android yet. It is likely also because our website is still only in English and not translated into other languages, so our Google search results are only in English. We also know that UFO/UAP awareness and popularity still seem to be somewhat larger in the U.S. than overseas. Although there are passionate UAP communities overseas, many of those countries have smaller populations.
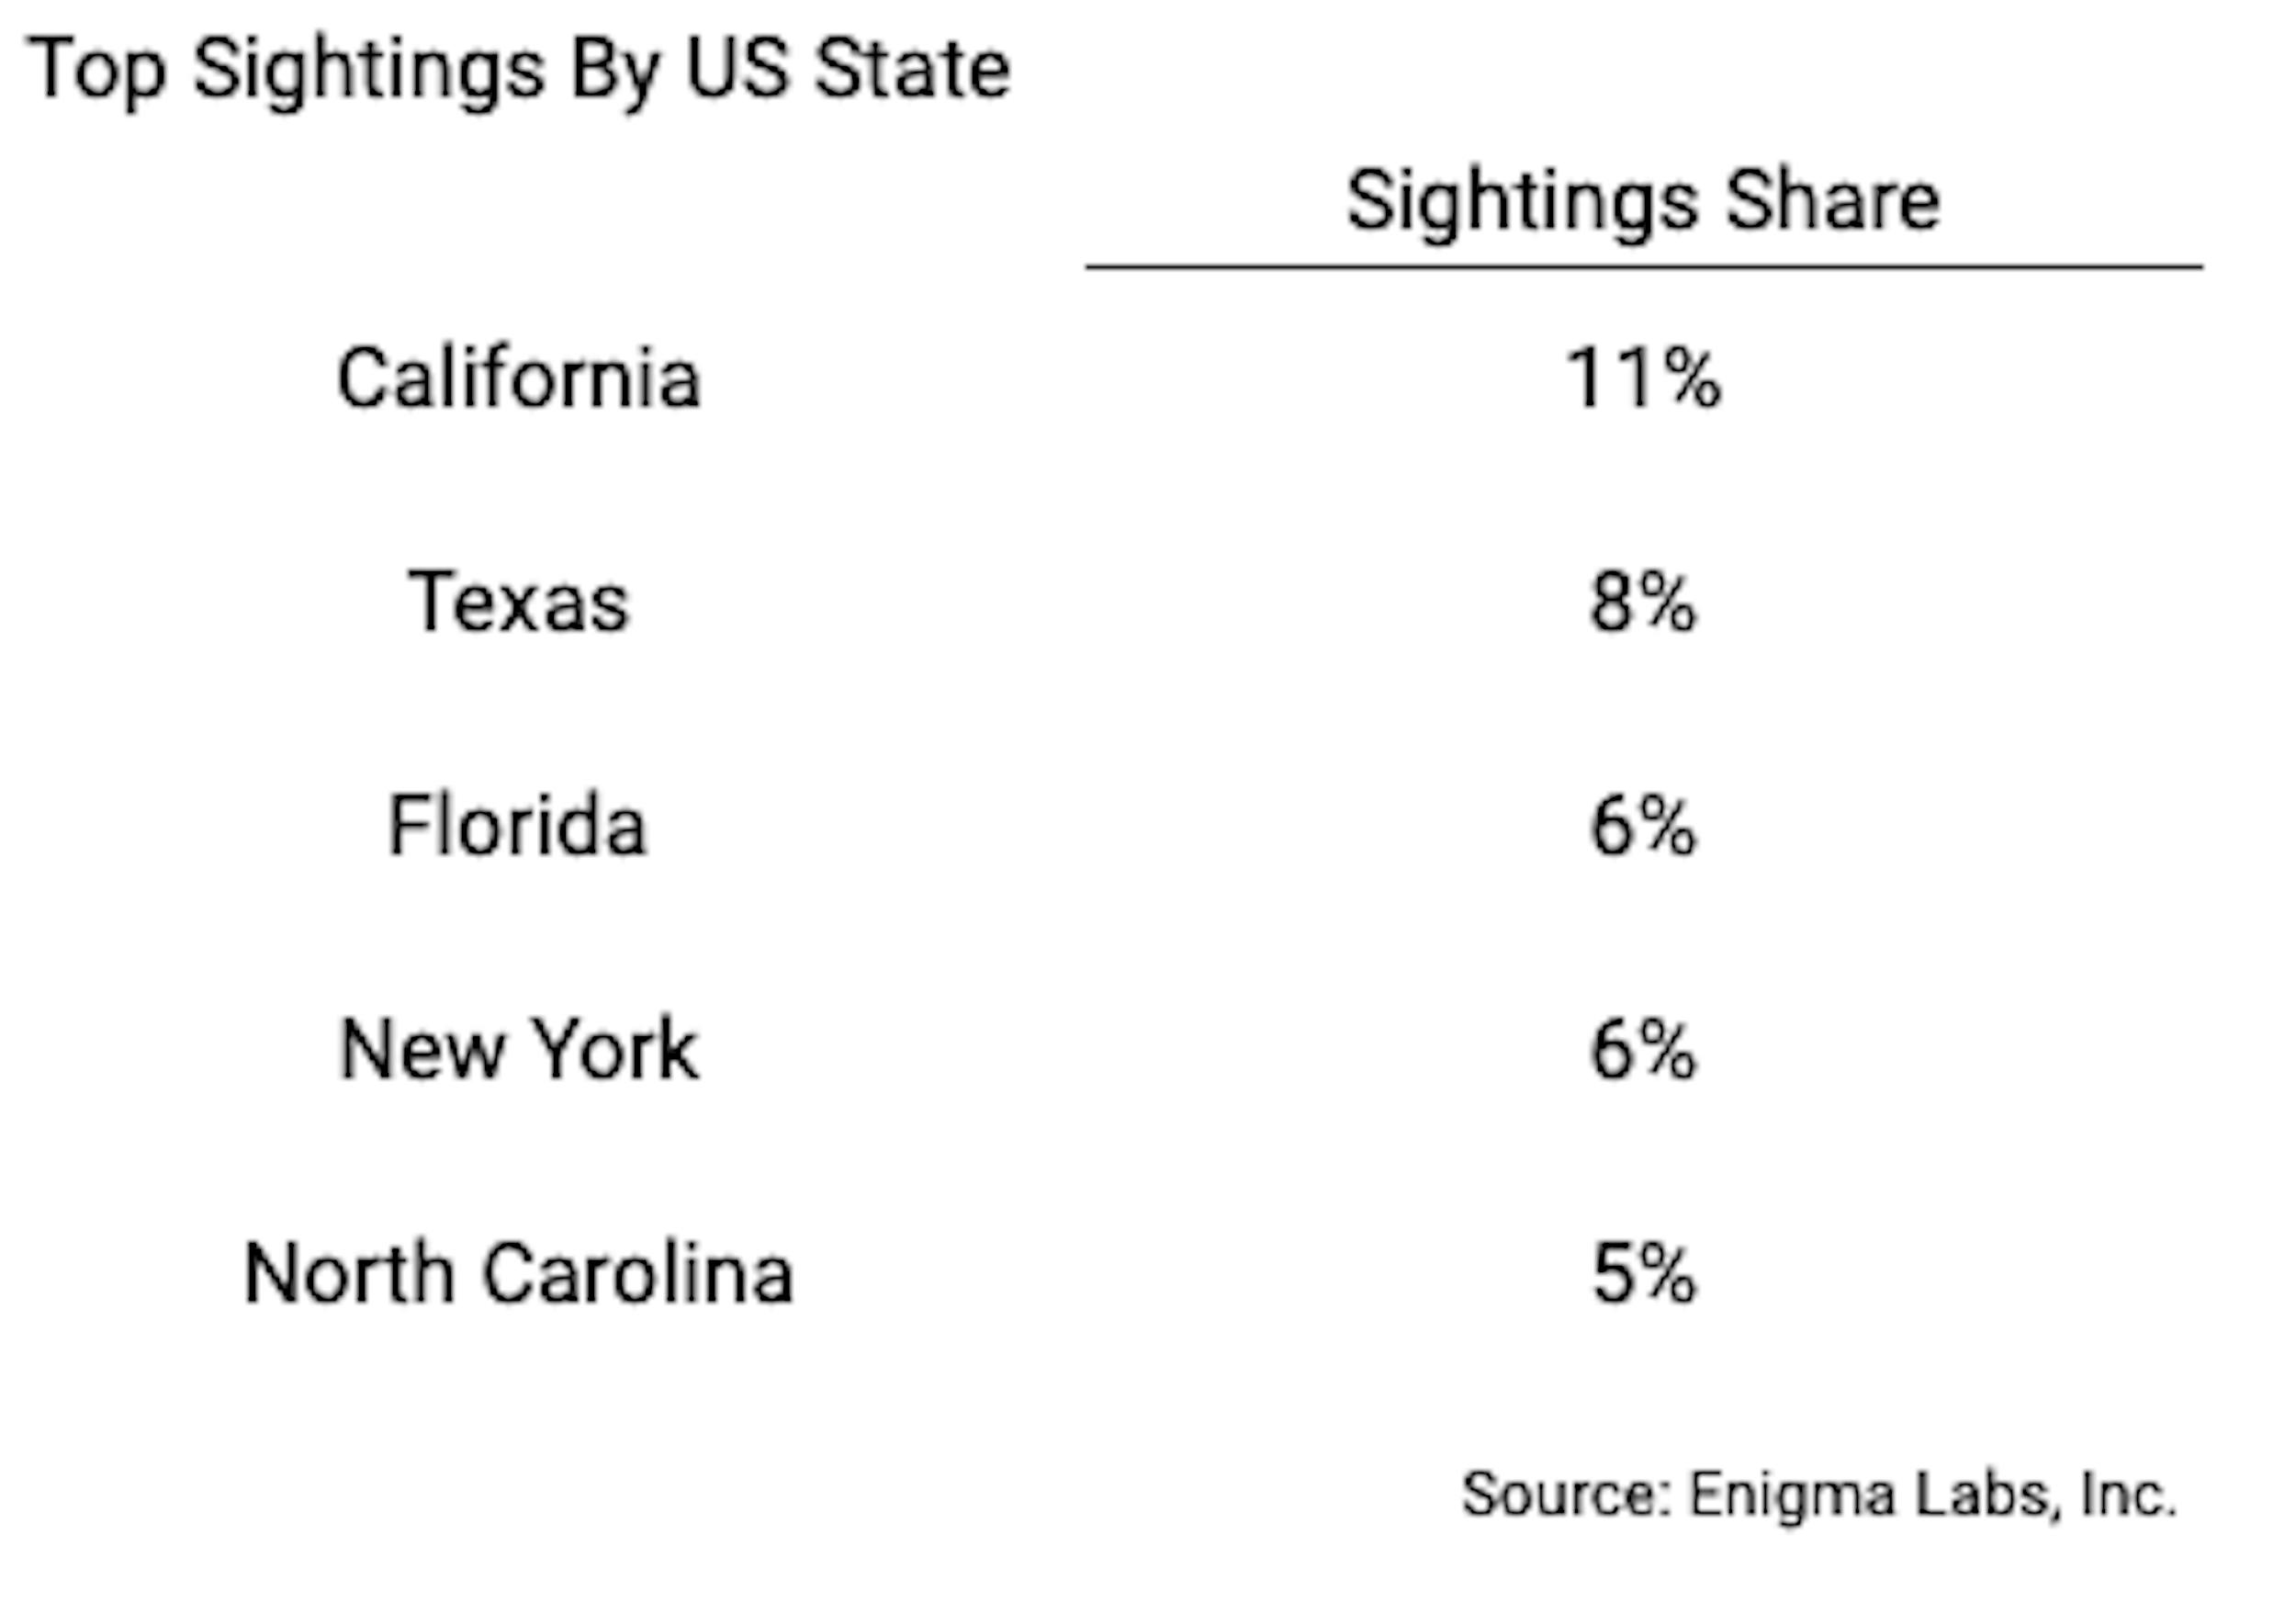
Sightings submitted – by state
Within the U.S., we have received sightings from all 50 states. The top states we’ve received sightings from seem to follow general population sizes, which is not a surprise – CA (29m), TX (29m), NY (19m) and FL (21m) are some of the top states we've received sightings from, and all have large populations. North Carolina has a slightly smaller population of 10m, and interestingly, it has appeared to be a UAP reporting hotspot the last few years:
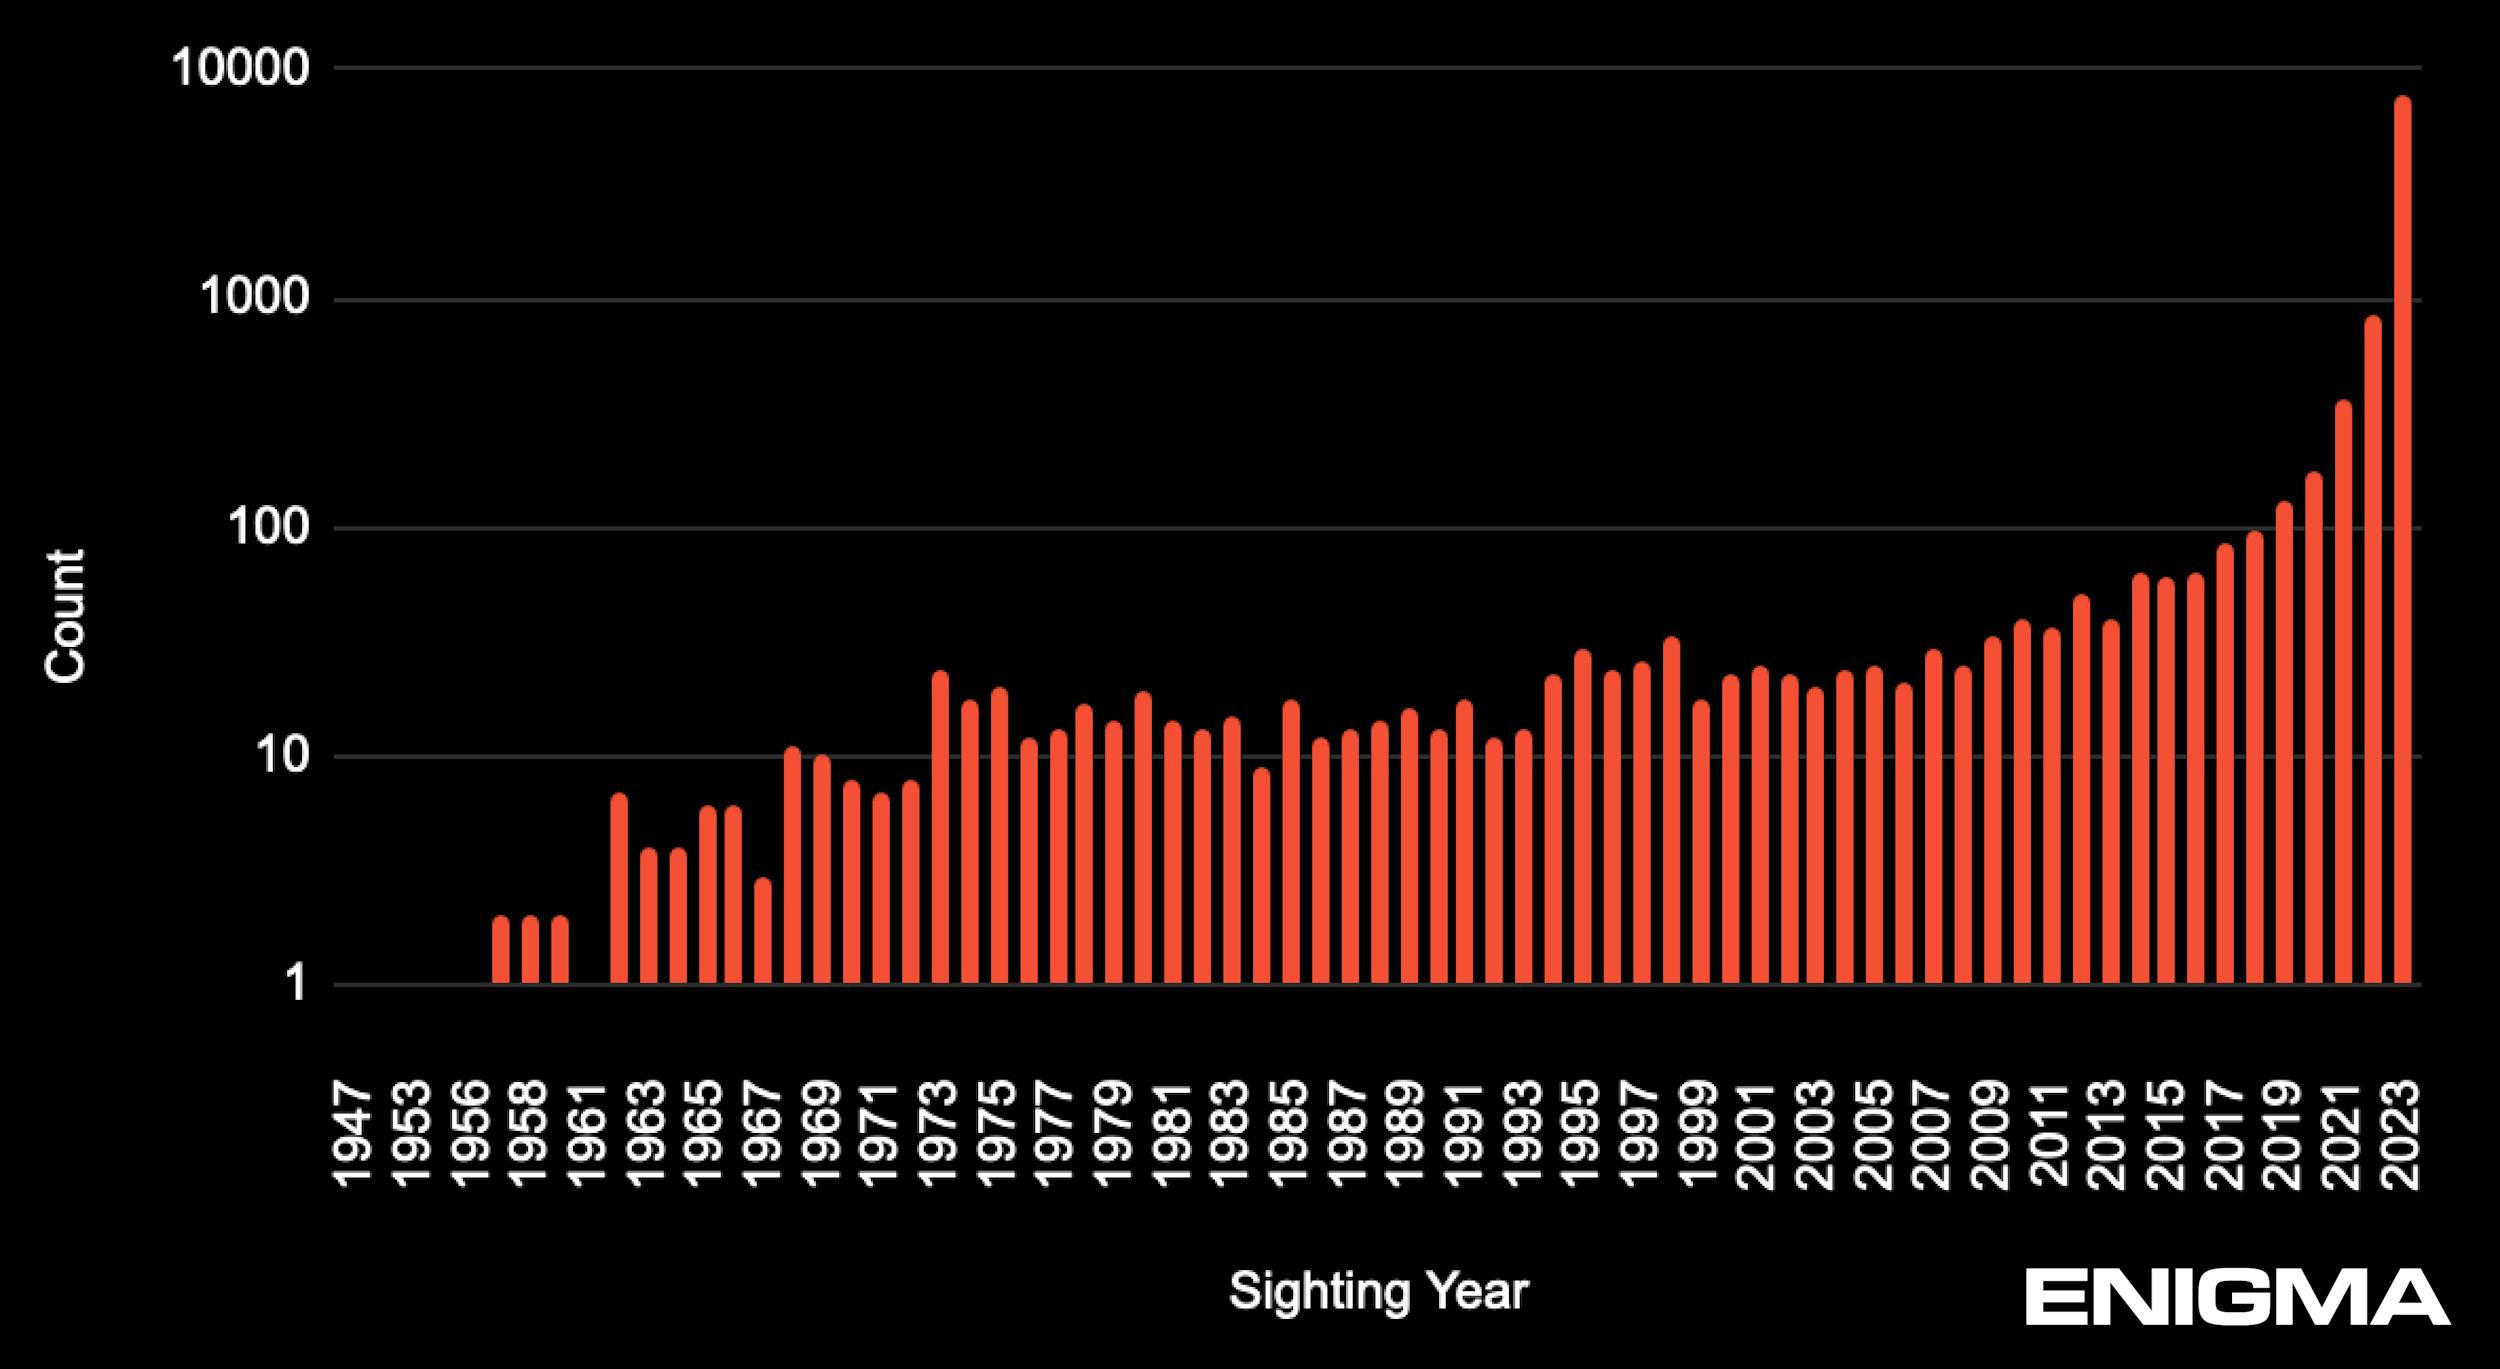
Submissions by sighting date
Our 12k submissions consisted of sightings as recent as December 2023 to experiences as long ago as 1947, spanning nearly 80 years. The majority of our submissions are shared soon after the sighter experiences the UAP.
Days where sightings spiked
Our sightings submitted have grown month over month as we have scaled our online presence via marketing and made submitting more frictionless. Nevertheless, we noticed a few dates where sighting submissions surged:
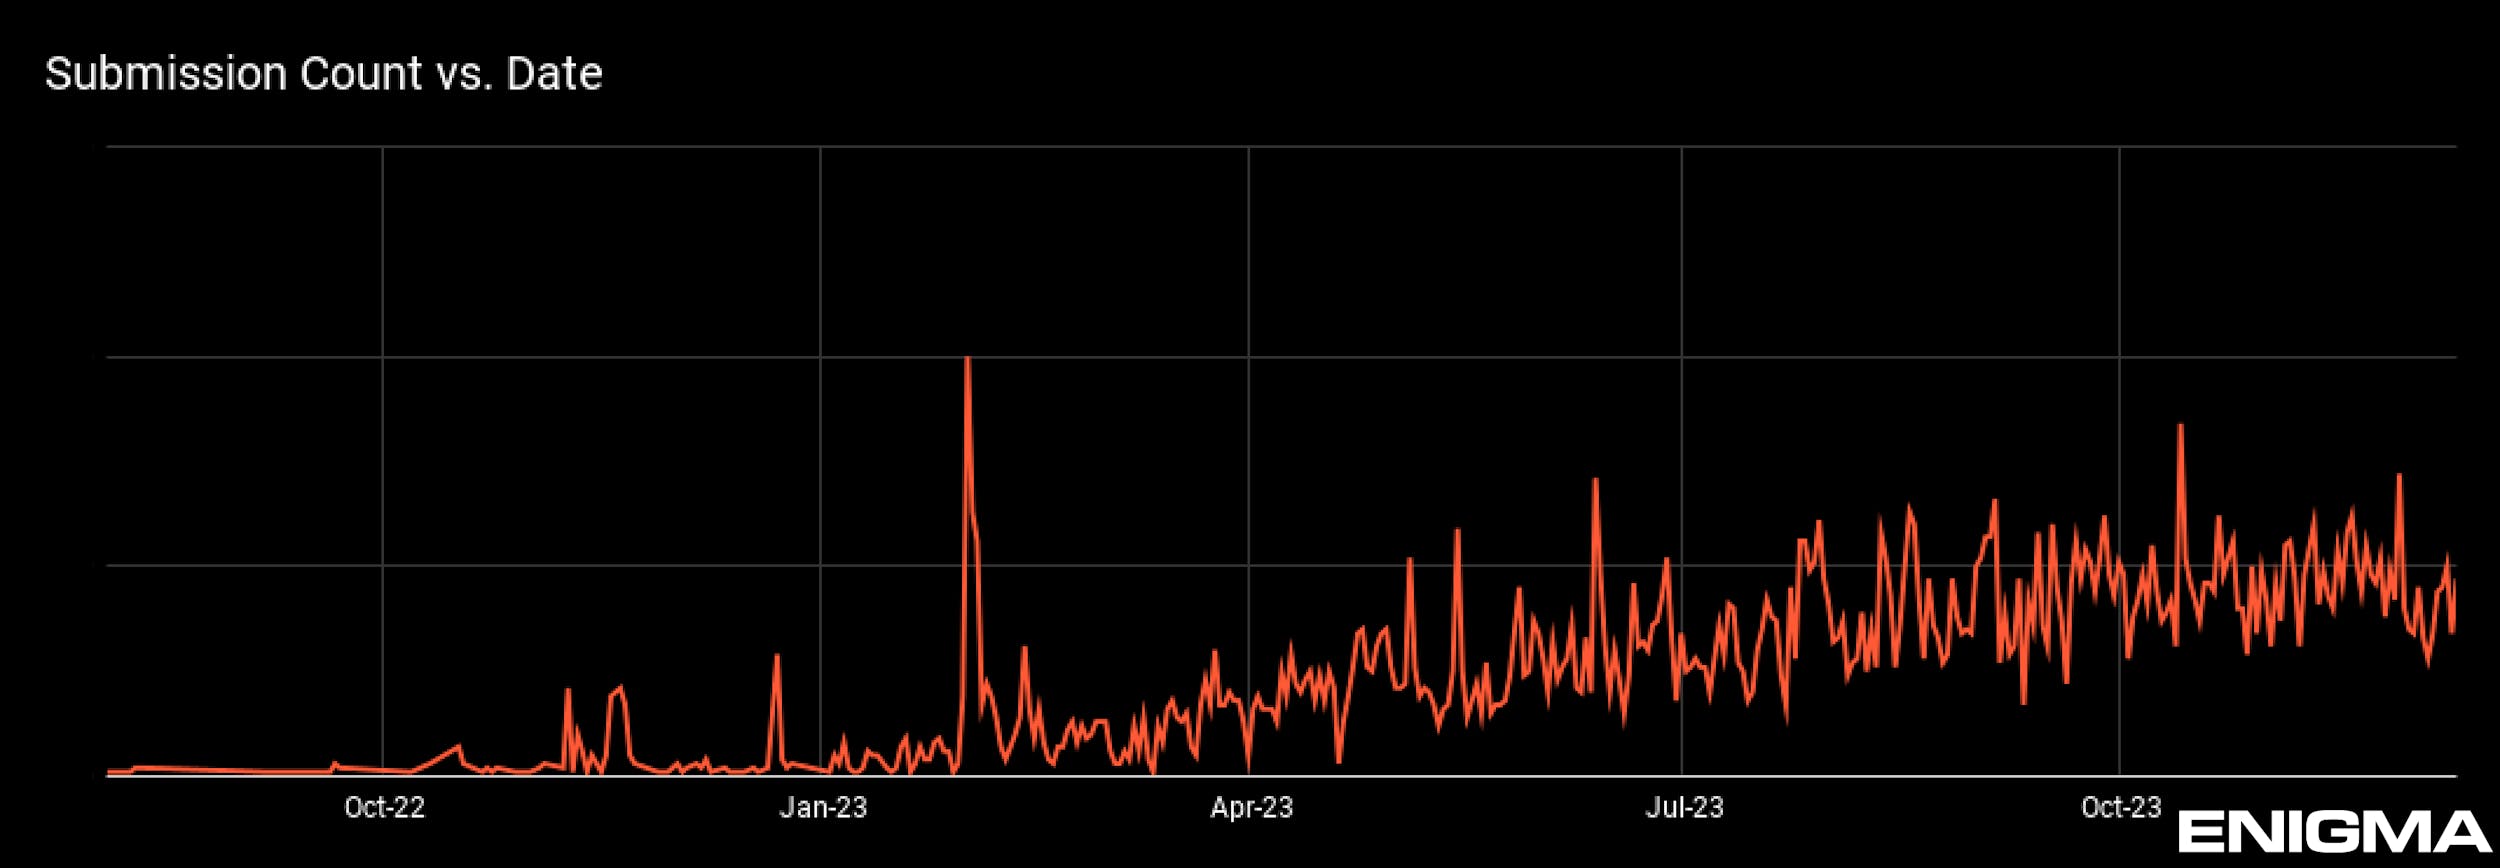
In February, we saw an interesting spike in submissions. You may recall the incident that month, when a foreign surveillance balloon was shot down. Three more unknown objects were then quickly shot down. Read more coverage of the events here. At that time, UFOs were all over the news, and on Twitter/X UFOs even out-trended the Superbowl on Superbowl Sunday, showing the wild interest in this topic. Generally, when UFO/UAP trends as a topic online, submissions numbers trend up.
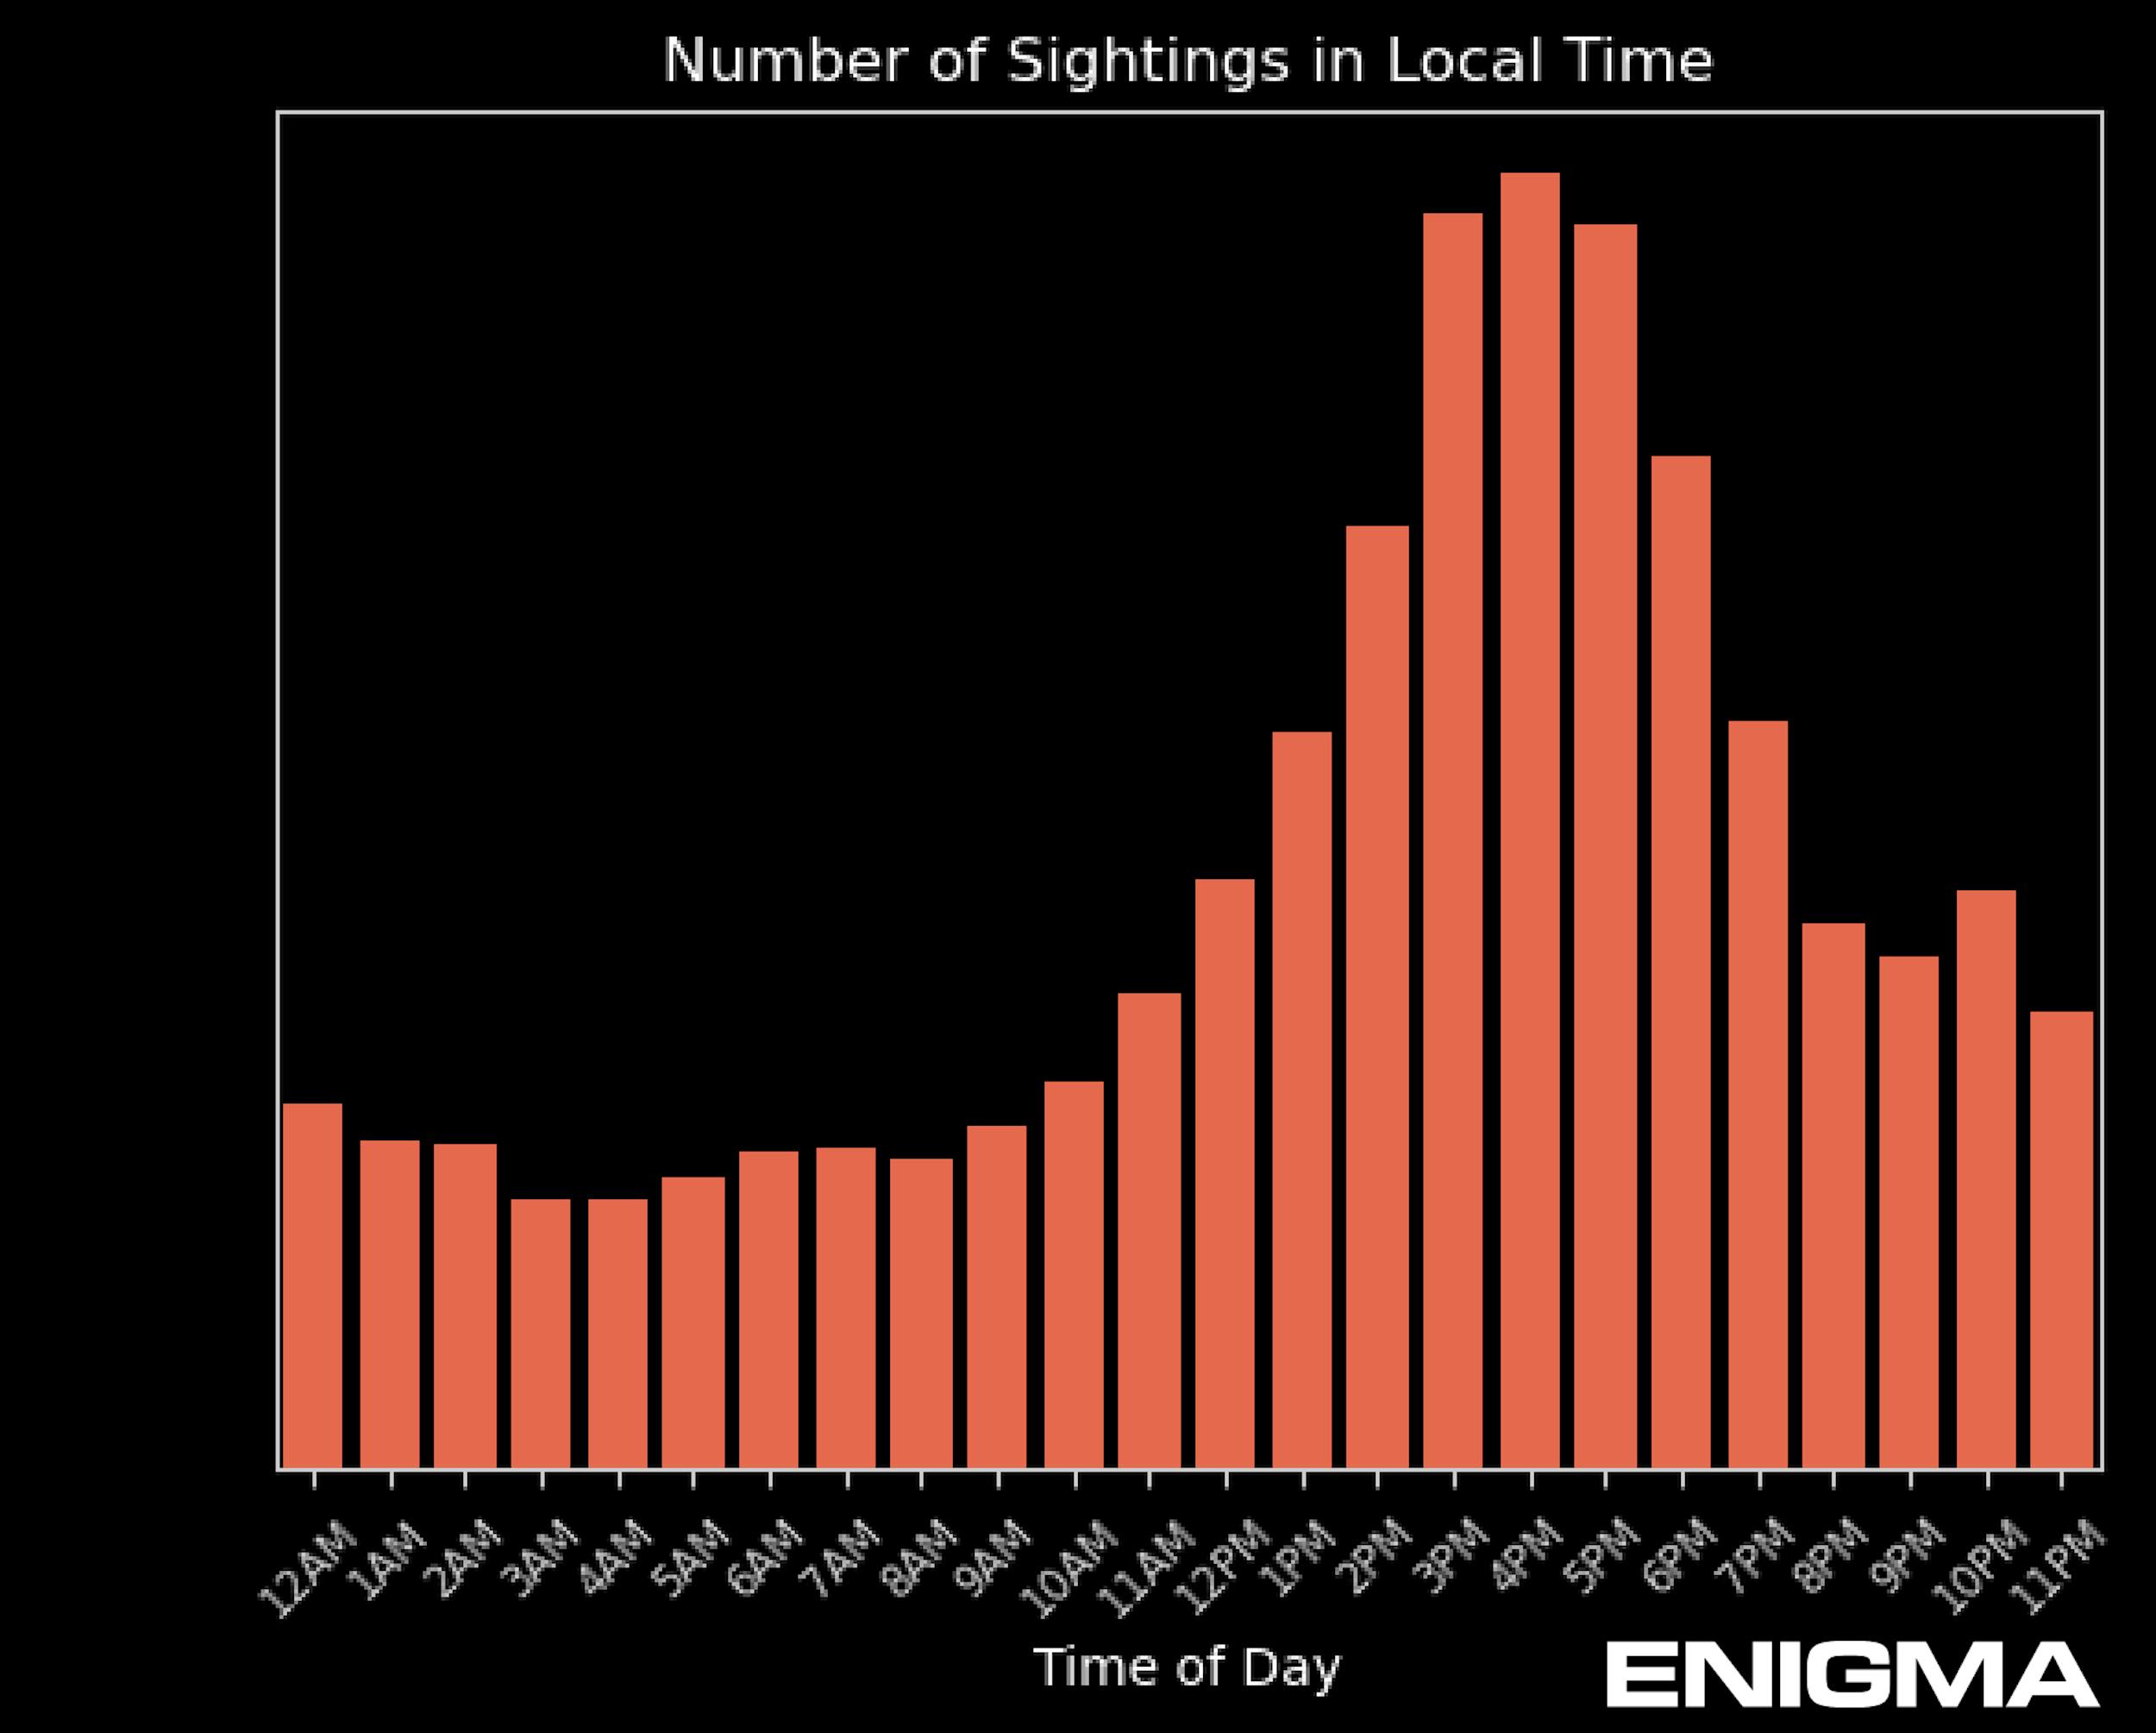
Sighting trends by time of day
We normalized sighting time for time zone, then queried the 12k dataset. We found that more than a quarter of the sightings take place between the hours of 3-6 pm. We have no sense yet of whether there is significance in this early data, given the small sample size. And if there is significance, whether it is due to correlation (more people are awake and outdoors in the afternoon?) or causation (more UAPs fly around in the afternoon?). Either way, we will continue to track and study this question:
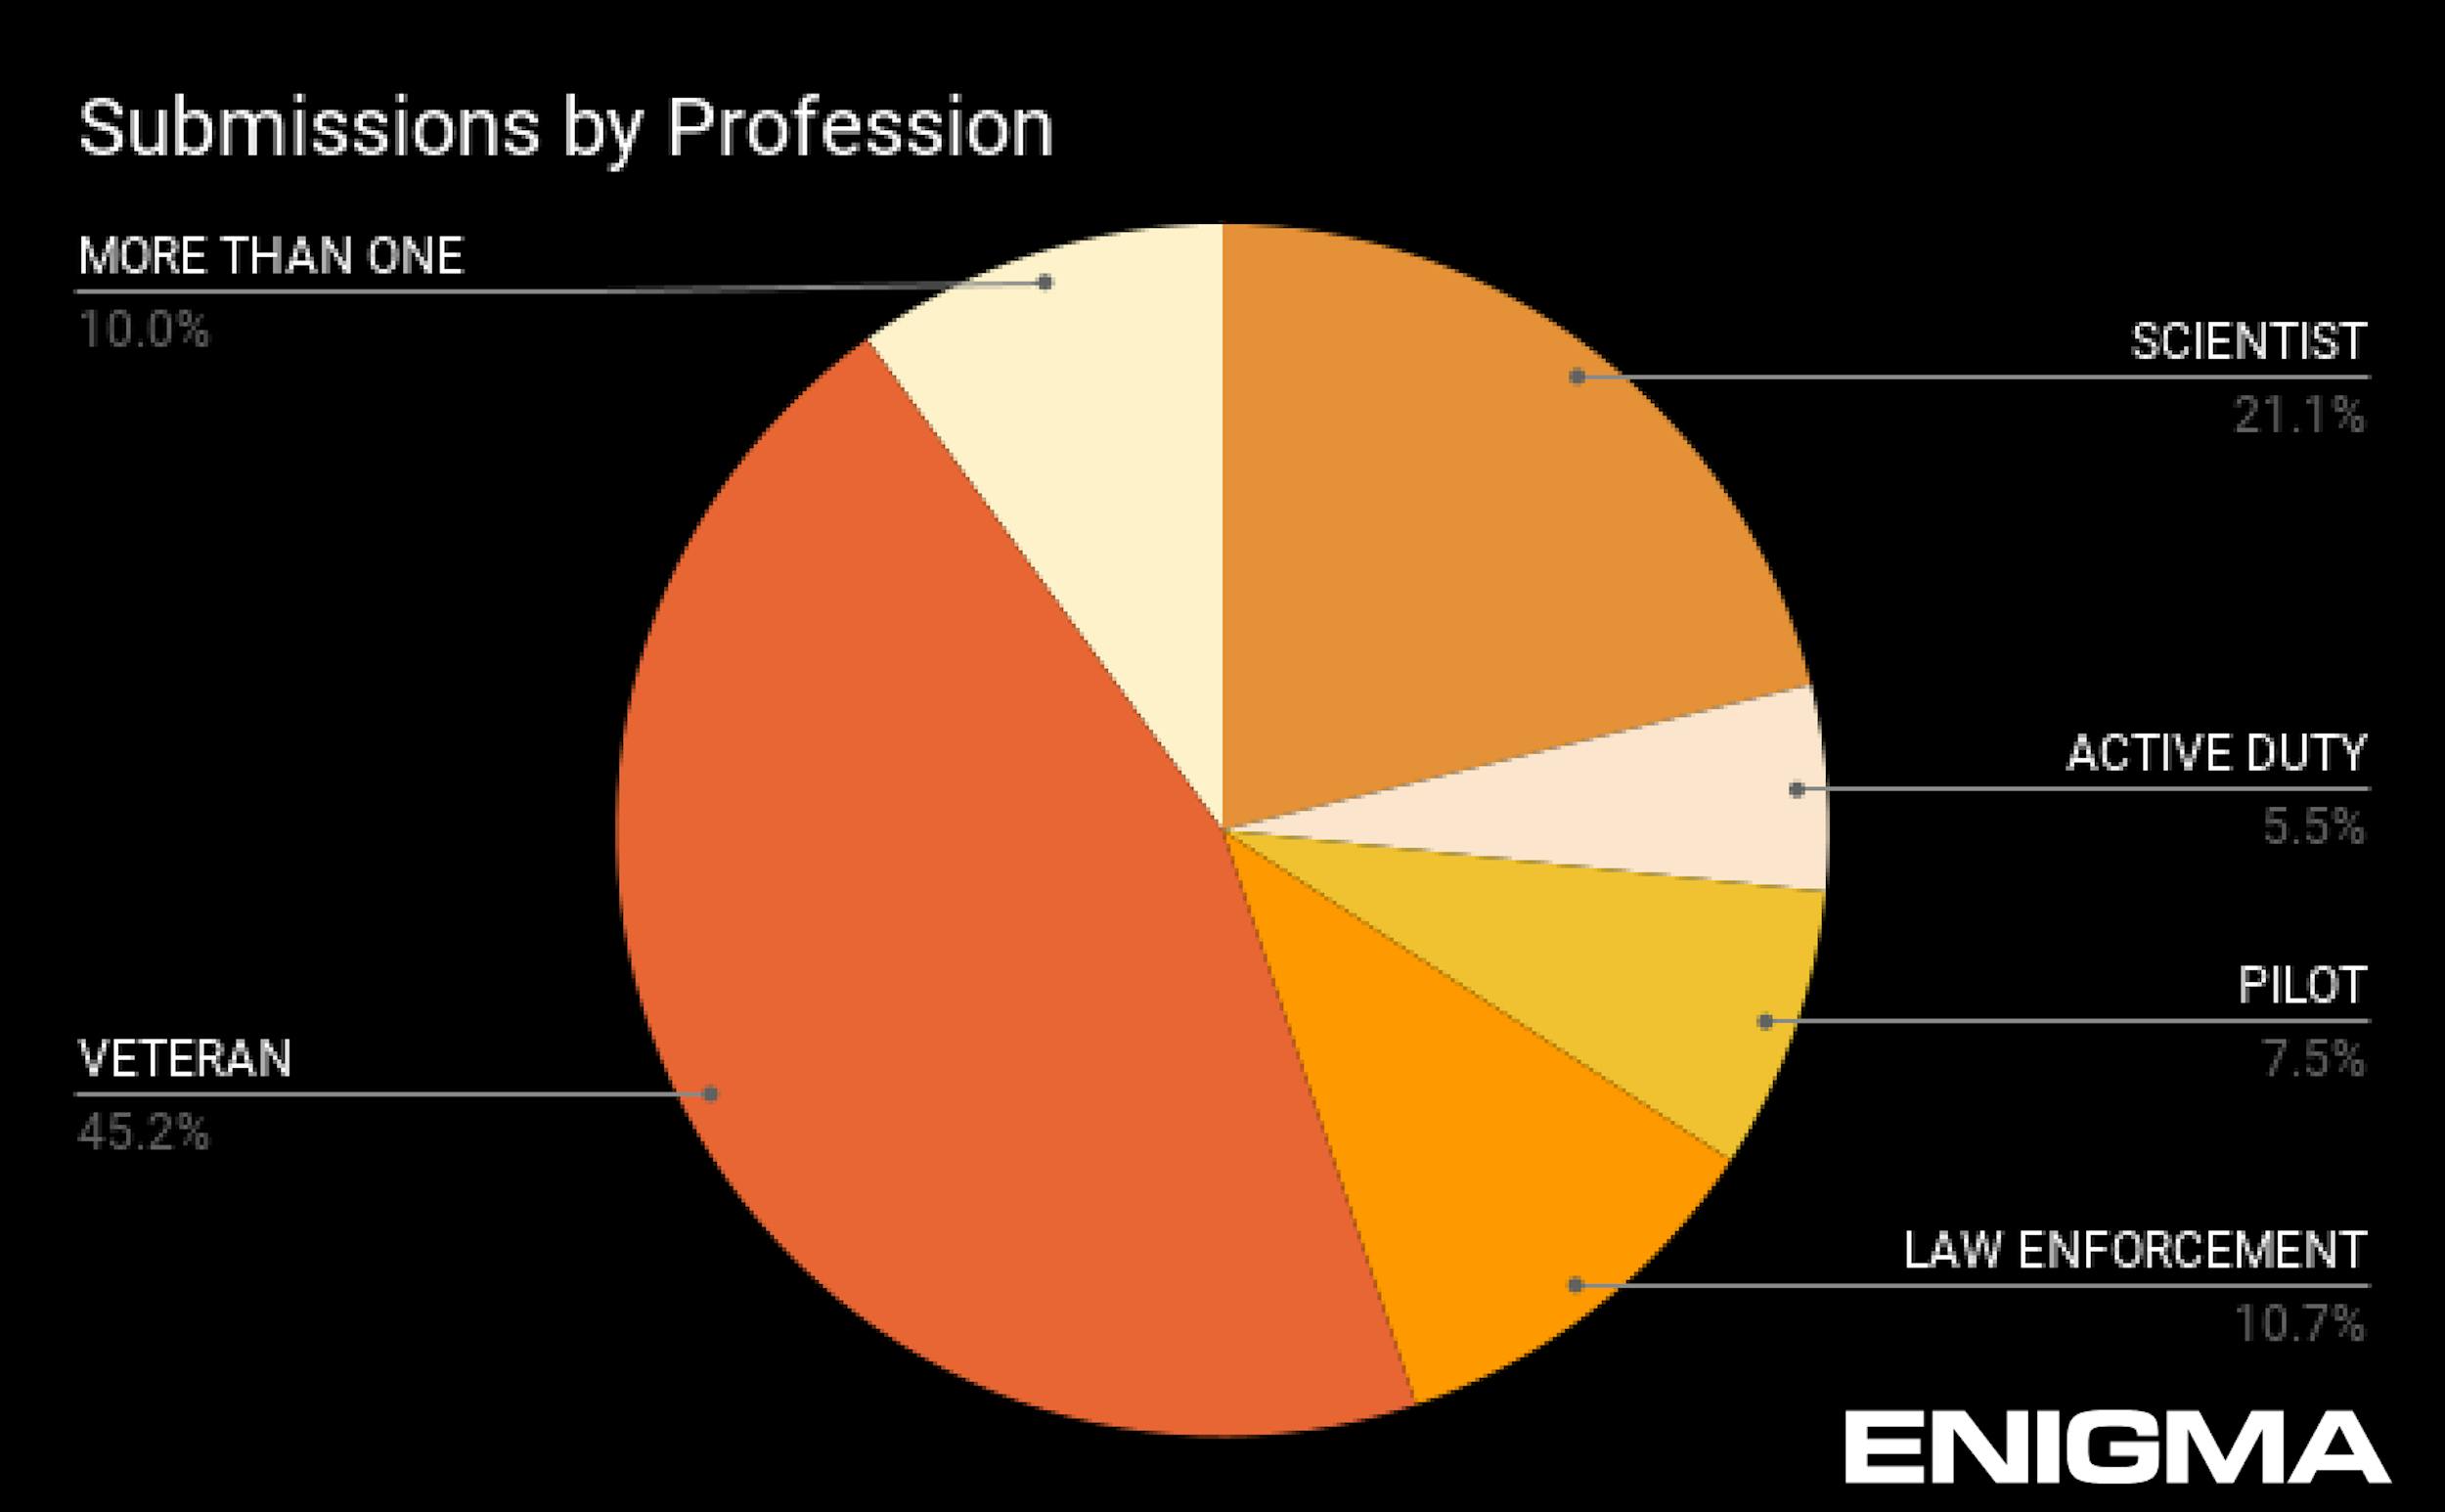
Who is reporting UAP to Enigma?
When submitting a sighting, users remain anonymous. They do have the option of sharing non-identifiable, demographic information along with their submission. 16% of submitters chose to share whether they were a scientist, active duty military, pilot, law enforcement, or veteran. Over 50% of those who shared their profession have served or are currently serving in the military, and 21% reported that they were a scientist by background, and 7.5% reported they were a pilot.
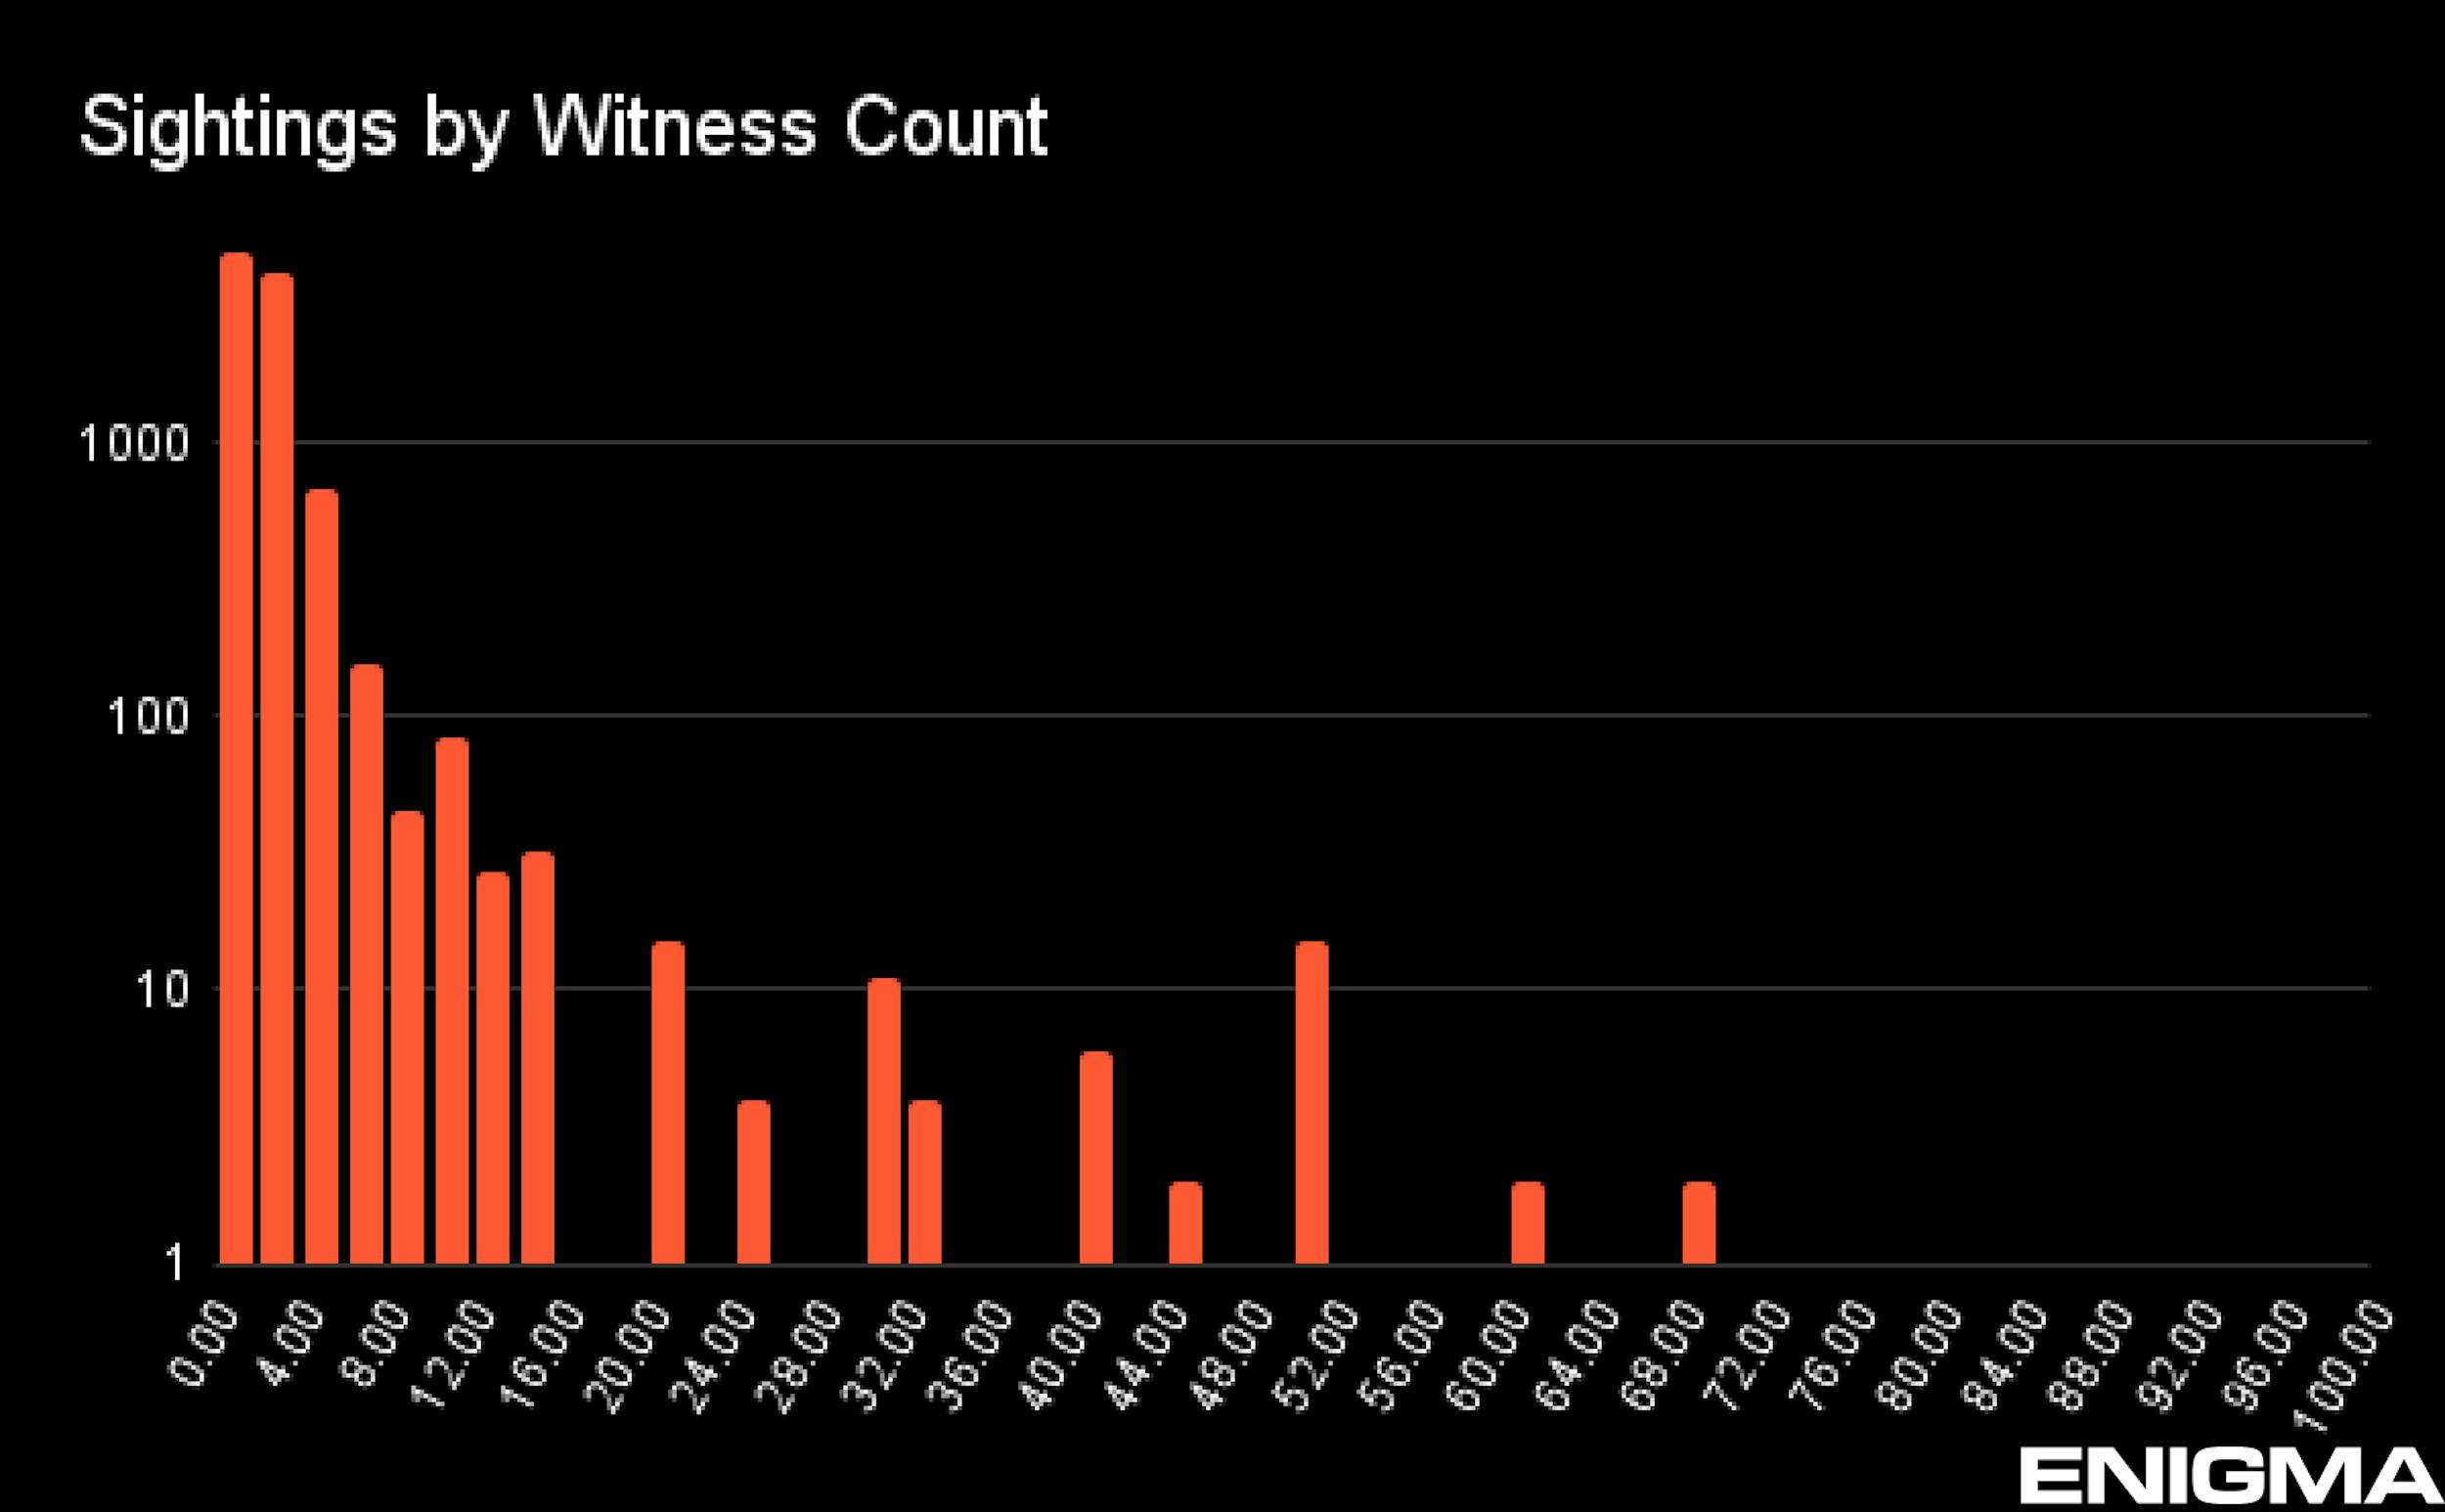
Number of witnesses per sighting
In 52% of sightings, more than one person had seen the unidentified object. 5% of sightings had more than 5 witnesses, and 1% of our sightings were witness by more than 30 people.
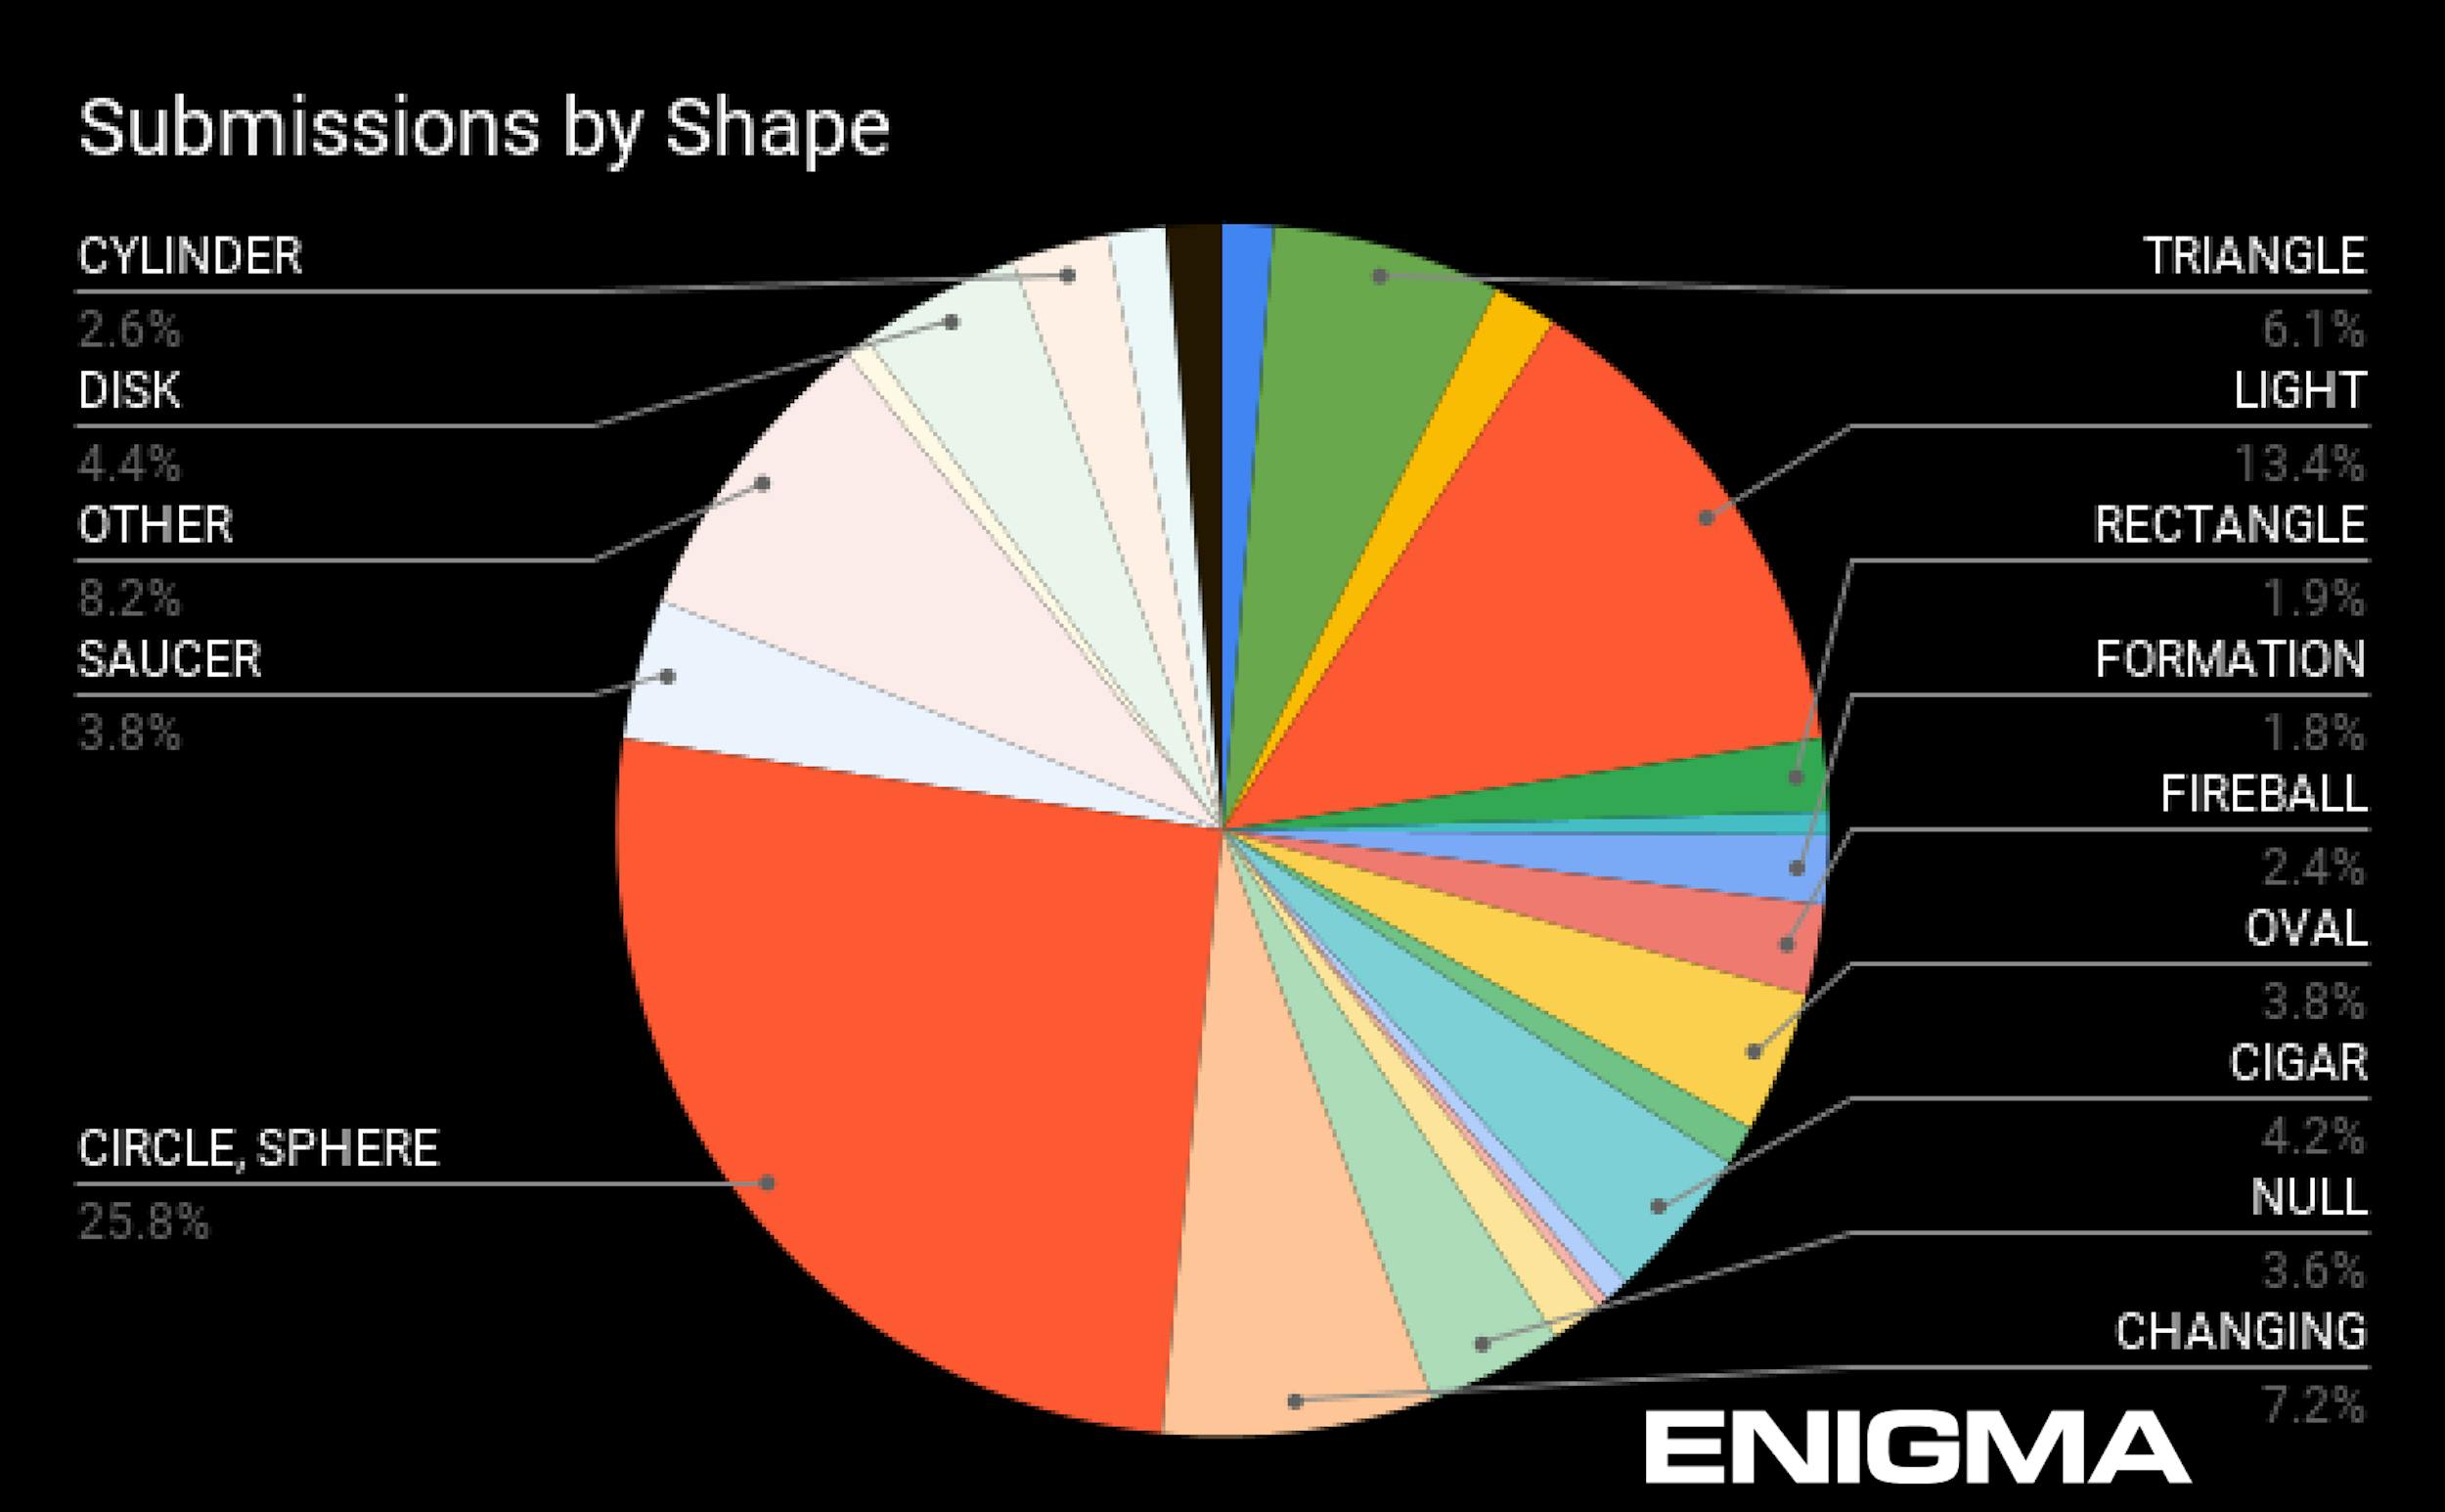
What do most commonly reported UAP look like?
Looking across the 12k sightings dataset, we noticed that 27% of sightings were circles or spheres. The next most commonly submitted shape in our dataset was “light.” This category is often used to describe points of light in the sky, which can be confused for known objects: stars, satellites, planes. So while some of those “lights” may indeed have been anomalous, we put less weight on the frequency of "light" in the shape data.
This sphere shape trend is in line with the broader trend outside of Enigma reports. We have found quite a few pilot anecdotes refer to orbs. As does AARO (All Domain Anomaly Resolution Office)’s recently published data showing that “orb” or “sphere” is the most commonly reported shape in the military reports over the last 25 years, at 34% of their reported sightings. Light was also AARO's second most commonly reported shape:
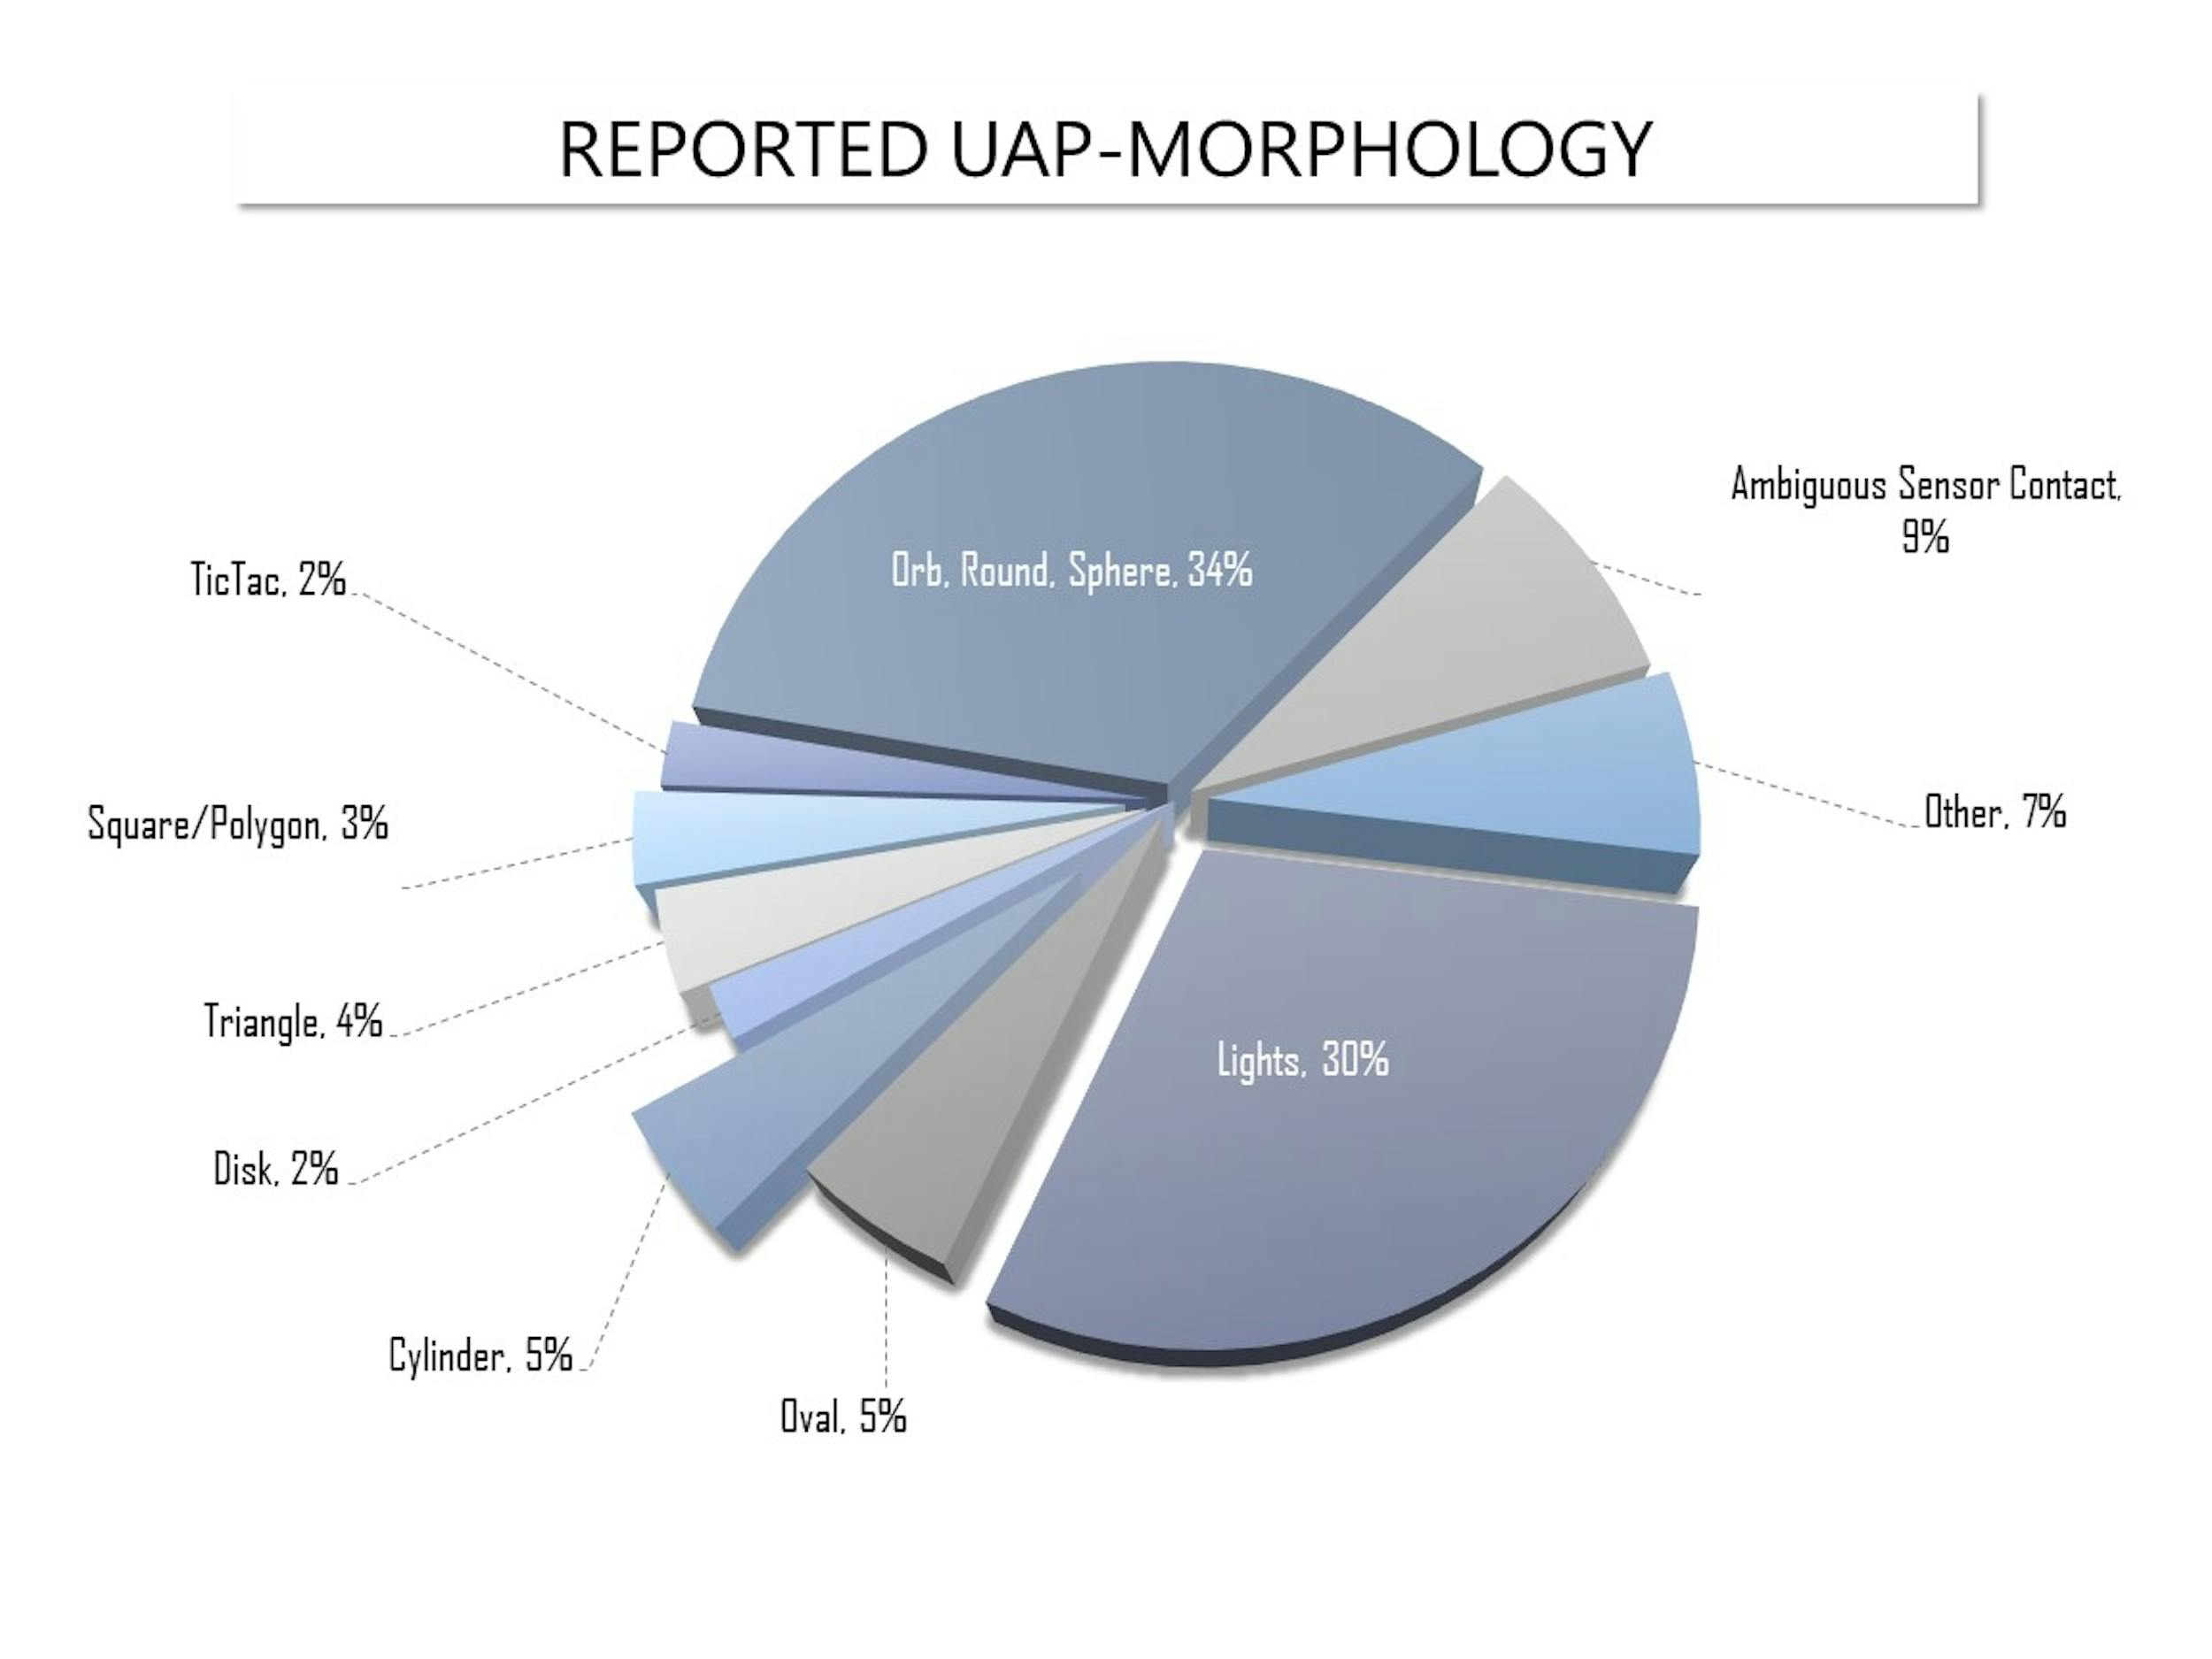
Source: AARO, 1996 - Nov 30, 2023 UAP Reporting Trends
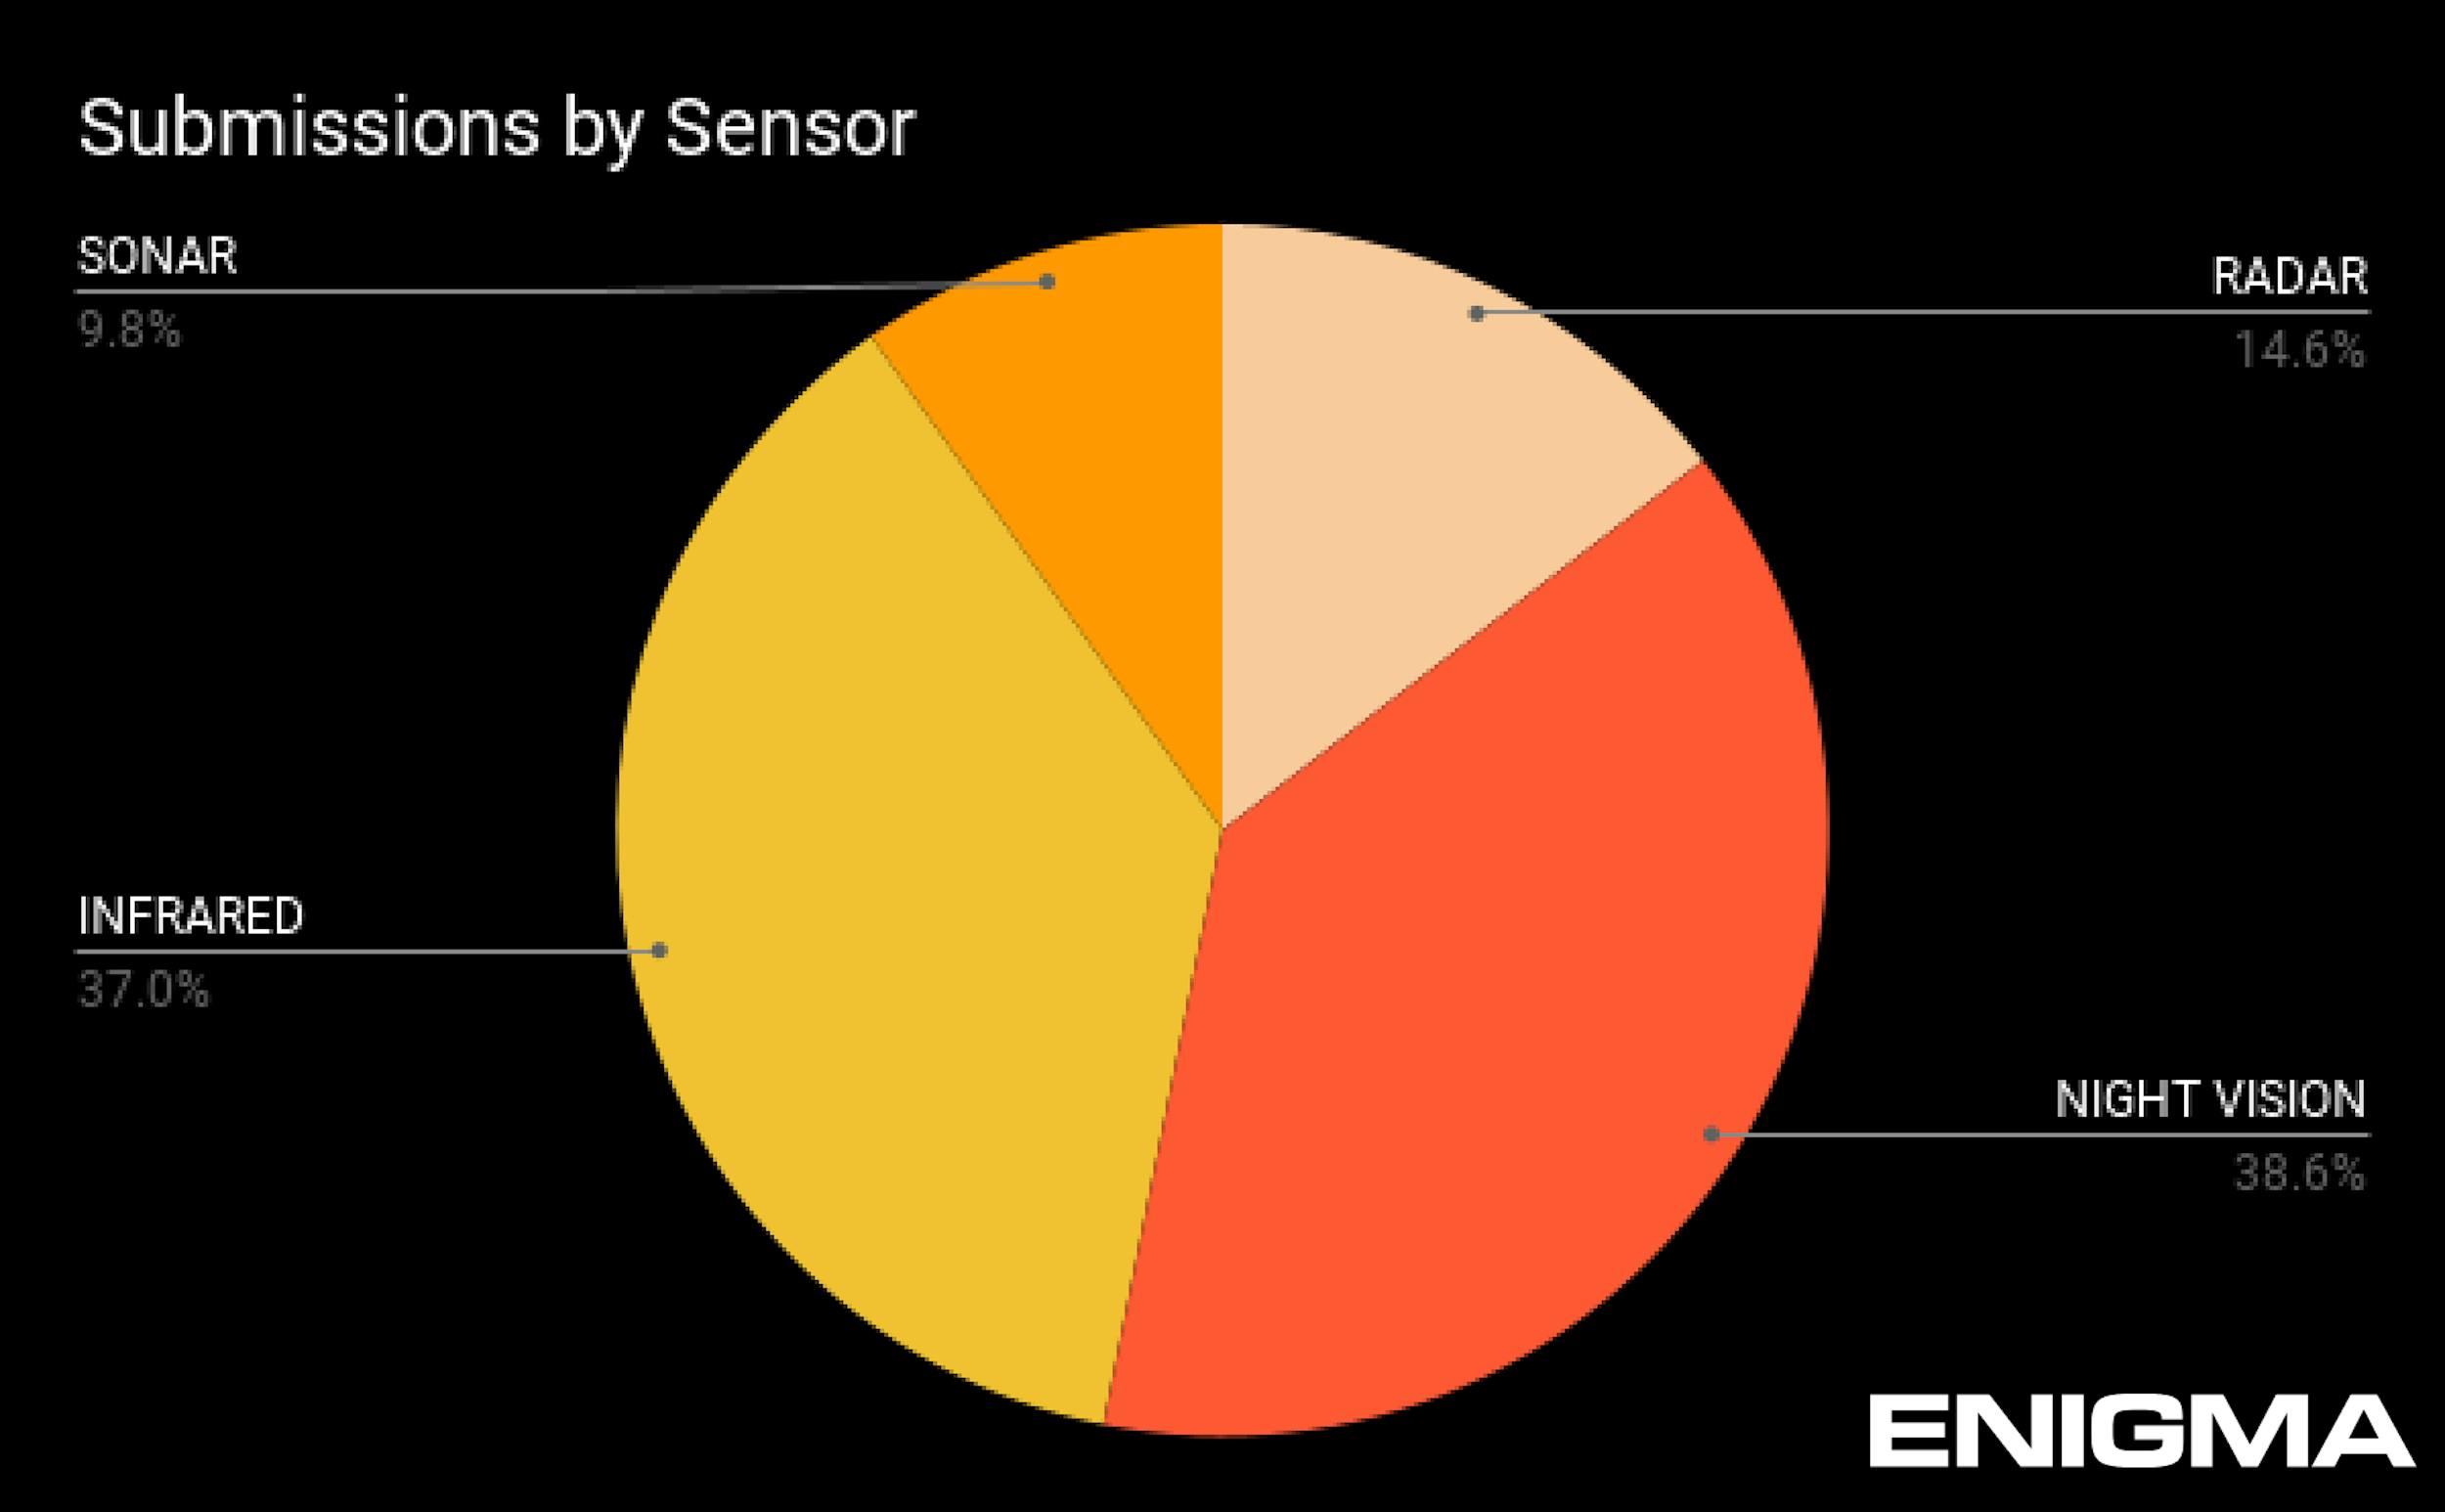
UAPs and sensor detection
Users self report whether or not any sensors captured the UAP. Of our 12K sighting submissions, 4% of users reported that sensors also detected the object. Most common were night vision and infrared sensors:
How many Enigma sightings were anomalous?
When it comes to analysis of anomalous behavior, we are still testing out the technology and tooling we will be rolling out in coming months – including triangulation, known object data layers, and independent sensor overlay. So for our commentary below on the first 12k submissions, we are only analyzing self-reported information from the sighting submitters.
Across the whole dataset, 30% of witnesses reported that they saw no observable means of propulsion on the object – including no fixed wings, a rotor, or exhaust jet. And 4% of witnesses said there was no observable means of propulsion, and that the object exhibited anomalous flight patterns, such as moving erratically in different directions, and at high speeds.
The Enigma score can help us to further analyze anomalousness, though the methodology of scoring continues to be regularly refined. Note that the score is a composite of both certainty around the sighting event, as well as how anomalous the object behavior was. Unsurprisingly, most the 12k sightings scored in the middle of the score range:
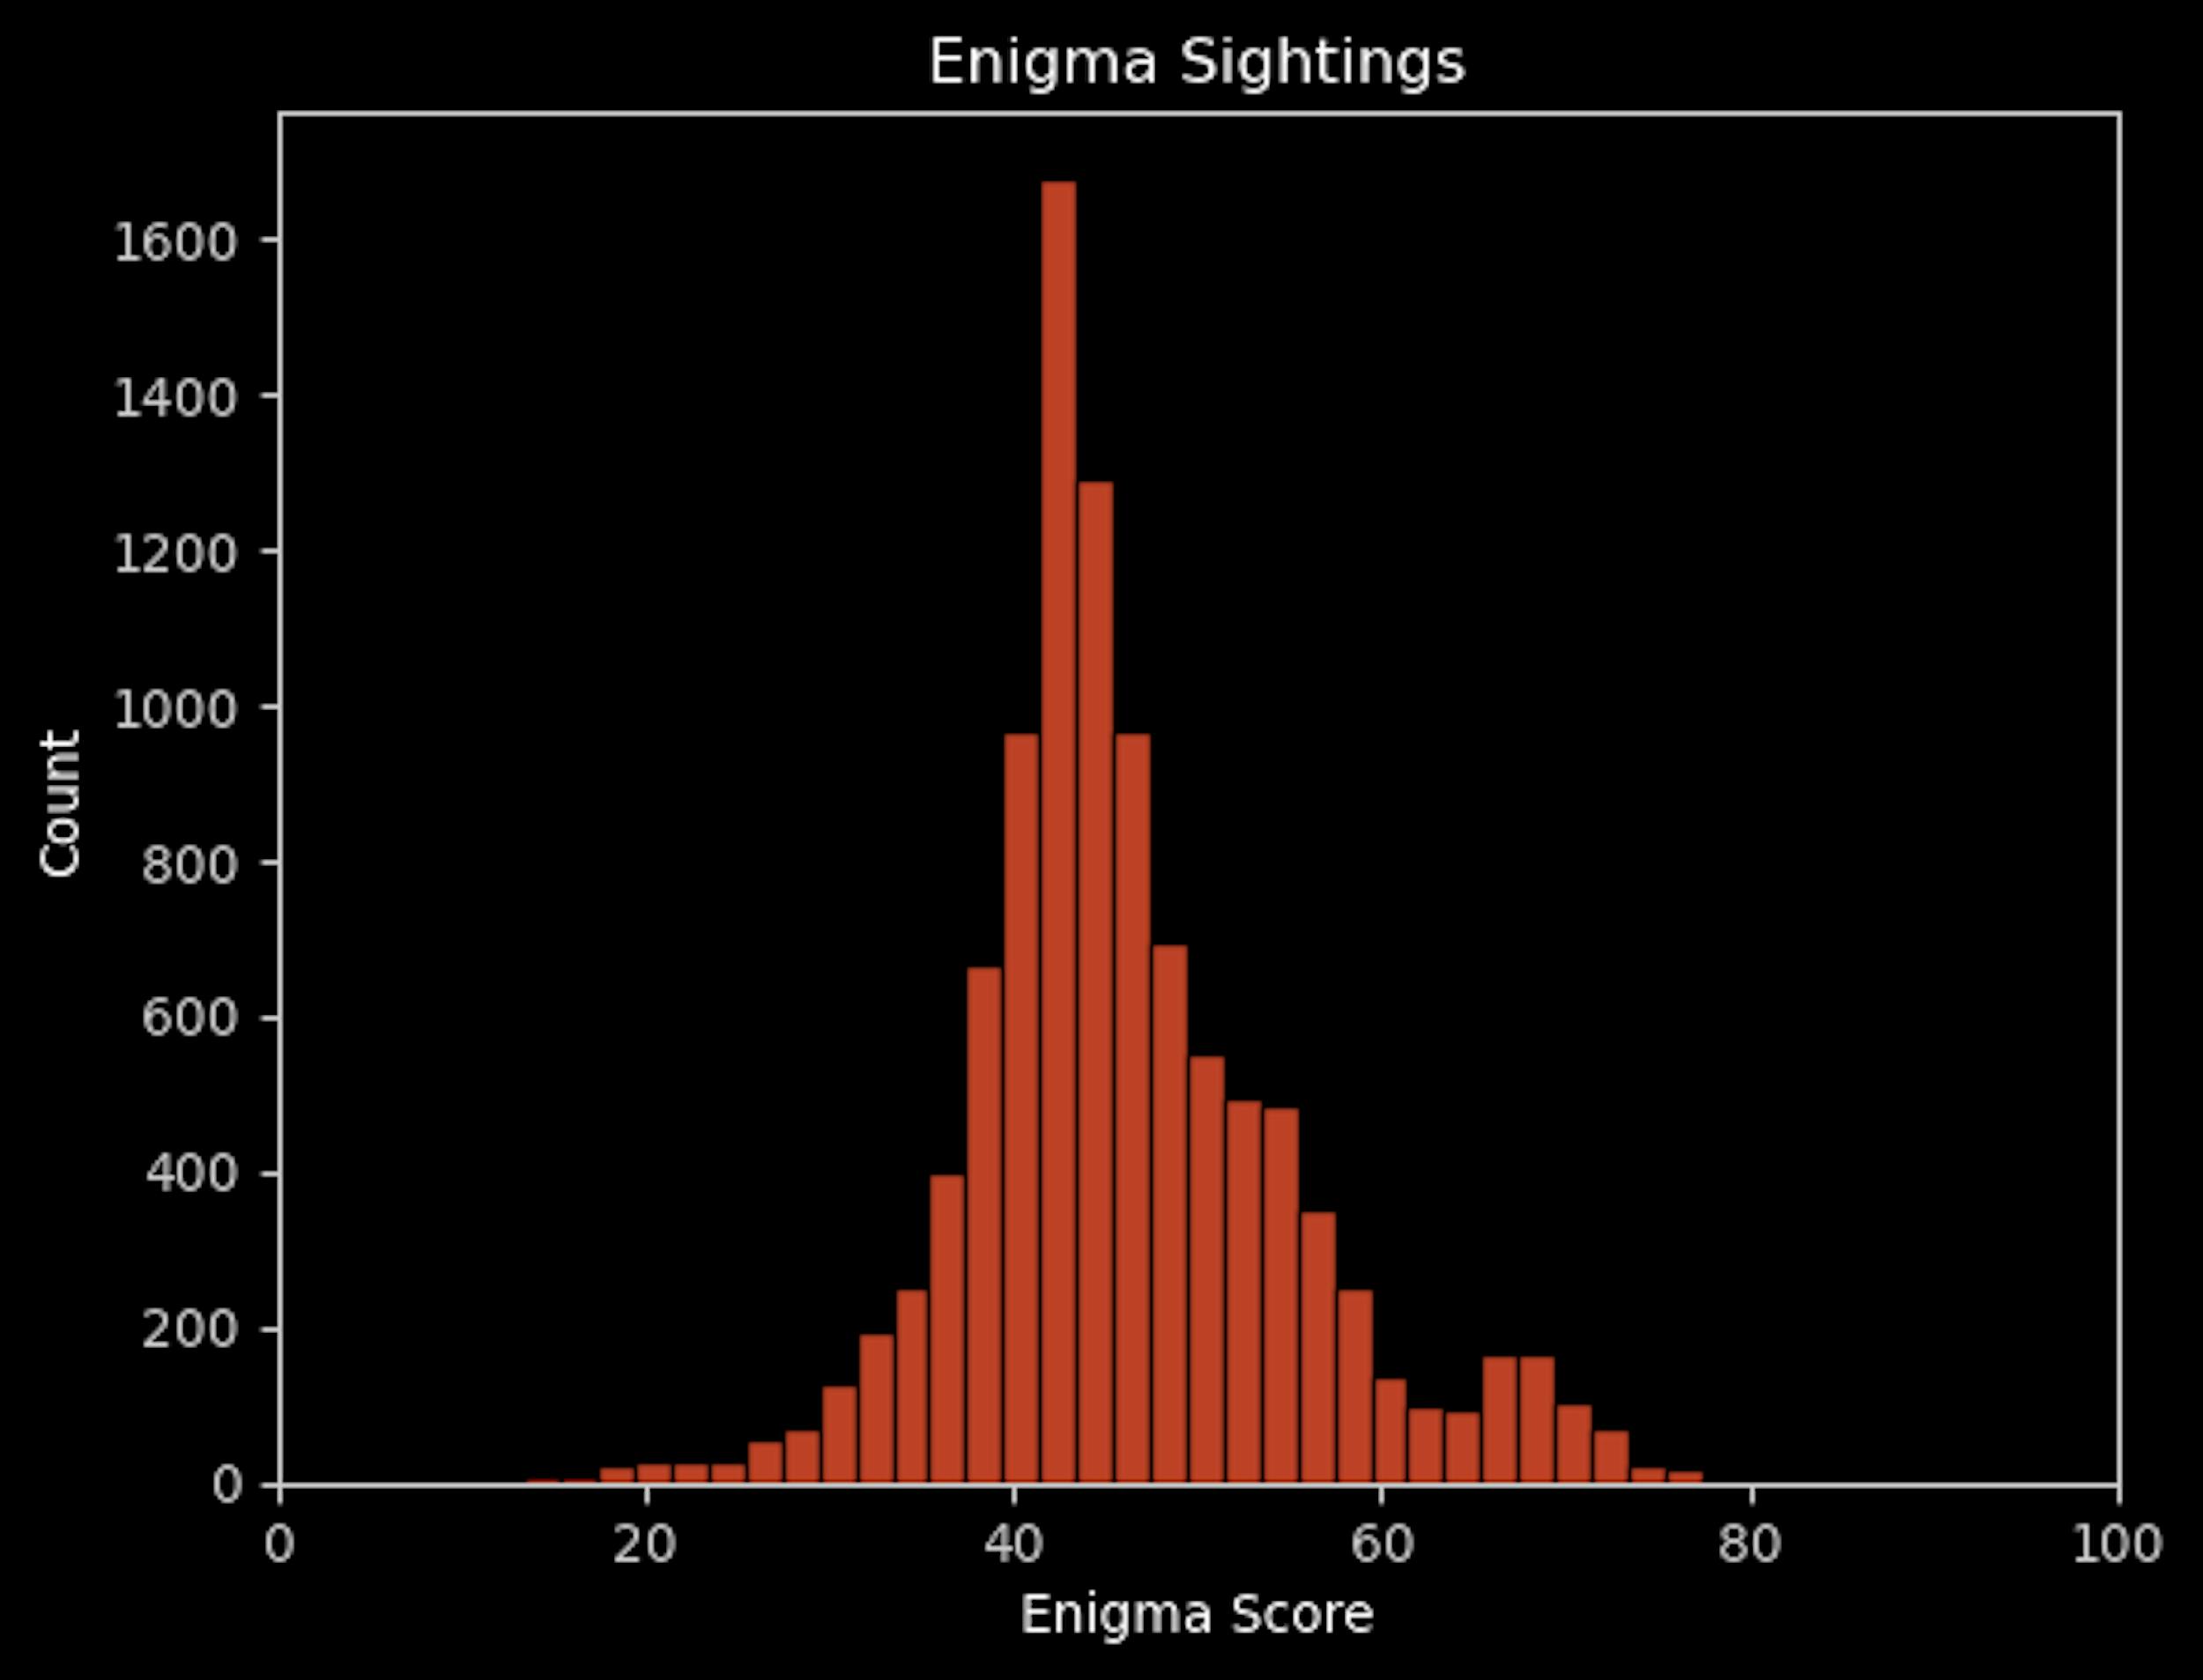
This distribution of scores is what we expected in our first 12k sightings. That is for a few reasons:
1/ To date, our focus has not been chasing more anomalous sightings or unusual stories. Our focus has been setting up a machine that serves people through frictionless reporting. We have now proven that that reporting system works, so we are now focused on optimizing and scaling it. As more and more people become aware of how to report a sighting, and the stigma around UFOs continues to decrease, we expect the volume of sightings submitted to grow. We need the system to function efficiently, even as volume grows. Over time, as Enigma enables broader aerial awareness and coverage of whats in the sky, we believe we will start to see interesting signal (anomalies) appear among the noise (known objects.) As the volume of total sightings submitted grows, we expect a small % of them to be truly anomalous.
2/ Scientist Jacques Vallée uses a scale of 1 to 7 to describe how anomalous a sighting or event is, with 1 being "not strange" to 7 "very strange." Across hundreds of thousands of reports Vallée looked at, he found the distribution of reports to be higher at the lower end of the score range. He said this is unsurprising, as people are less shy about reporting something not that strange. As the “strangeness” of a sighting increases – by his measure, this would include seeing objects close up, seeing entities, or potentially experiencing abductions – the likelihood of people sharing goes down. He points out that all the unreported, "stranger" events makes it hard for us to know the actual distribution of anomalous sightings or events that occurred. We only see the distribution of people willing to share their sighting story.
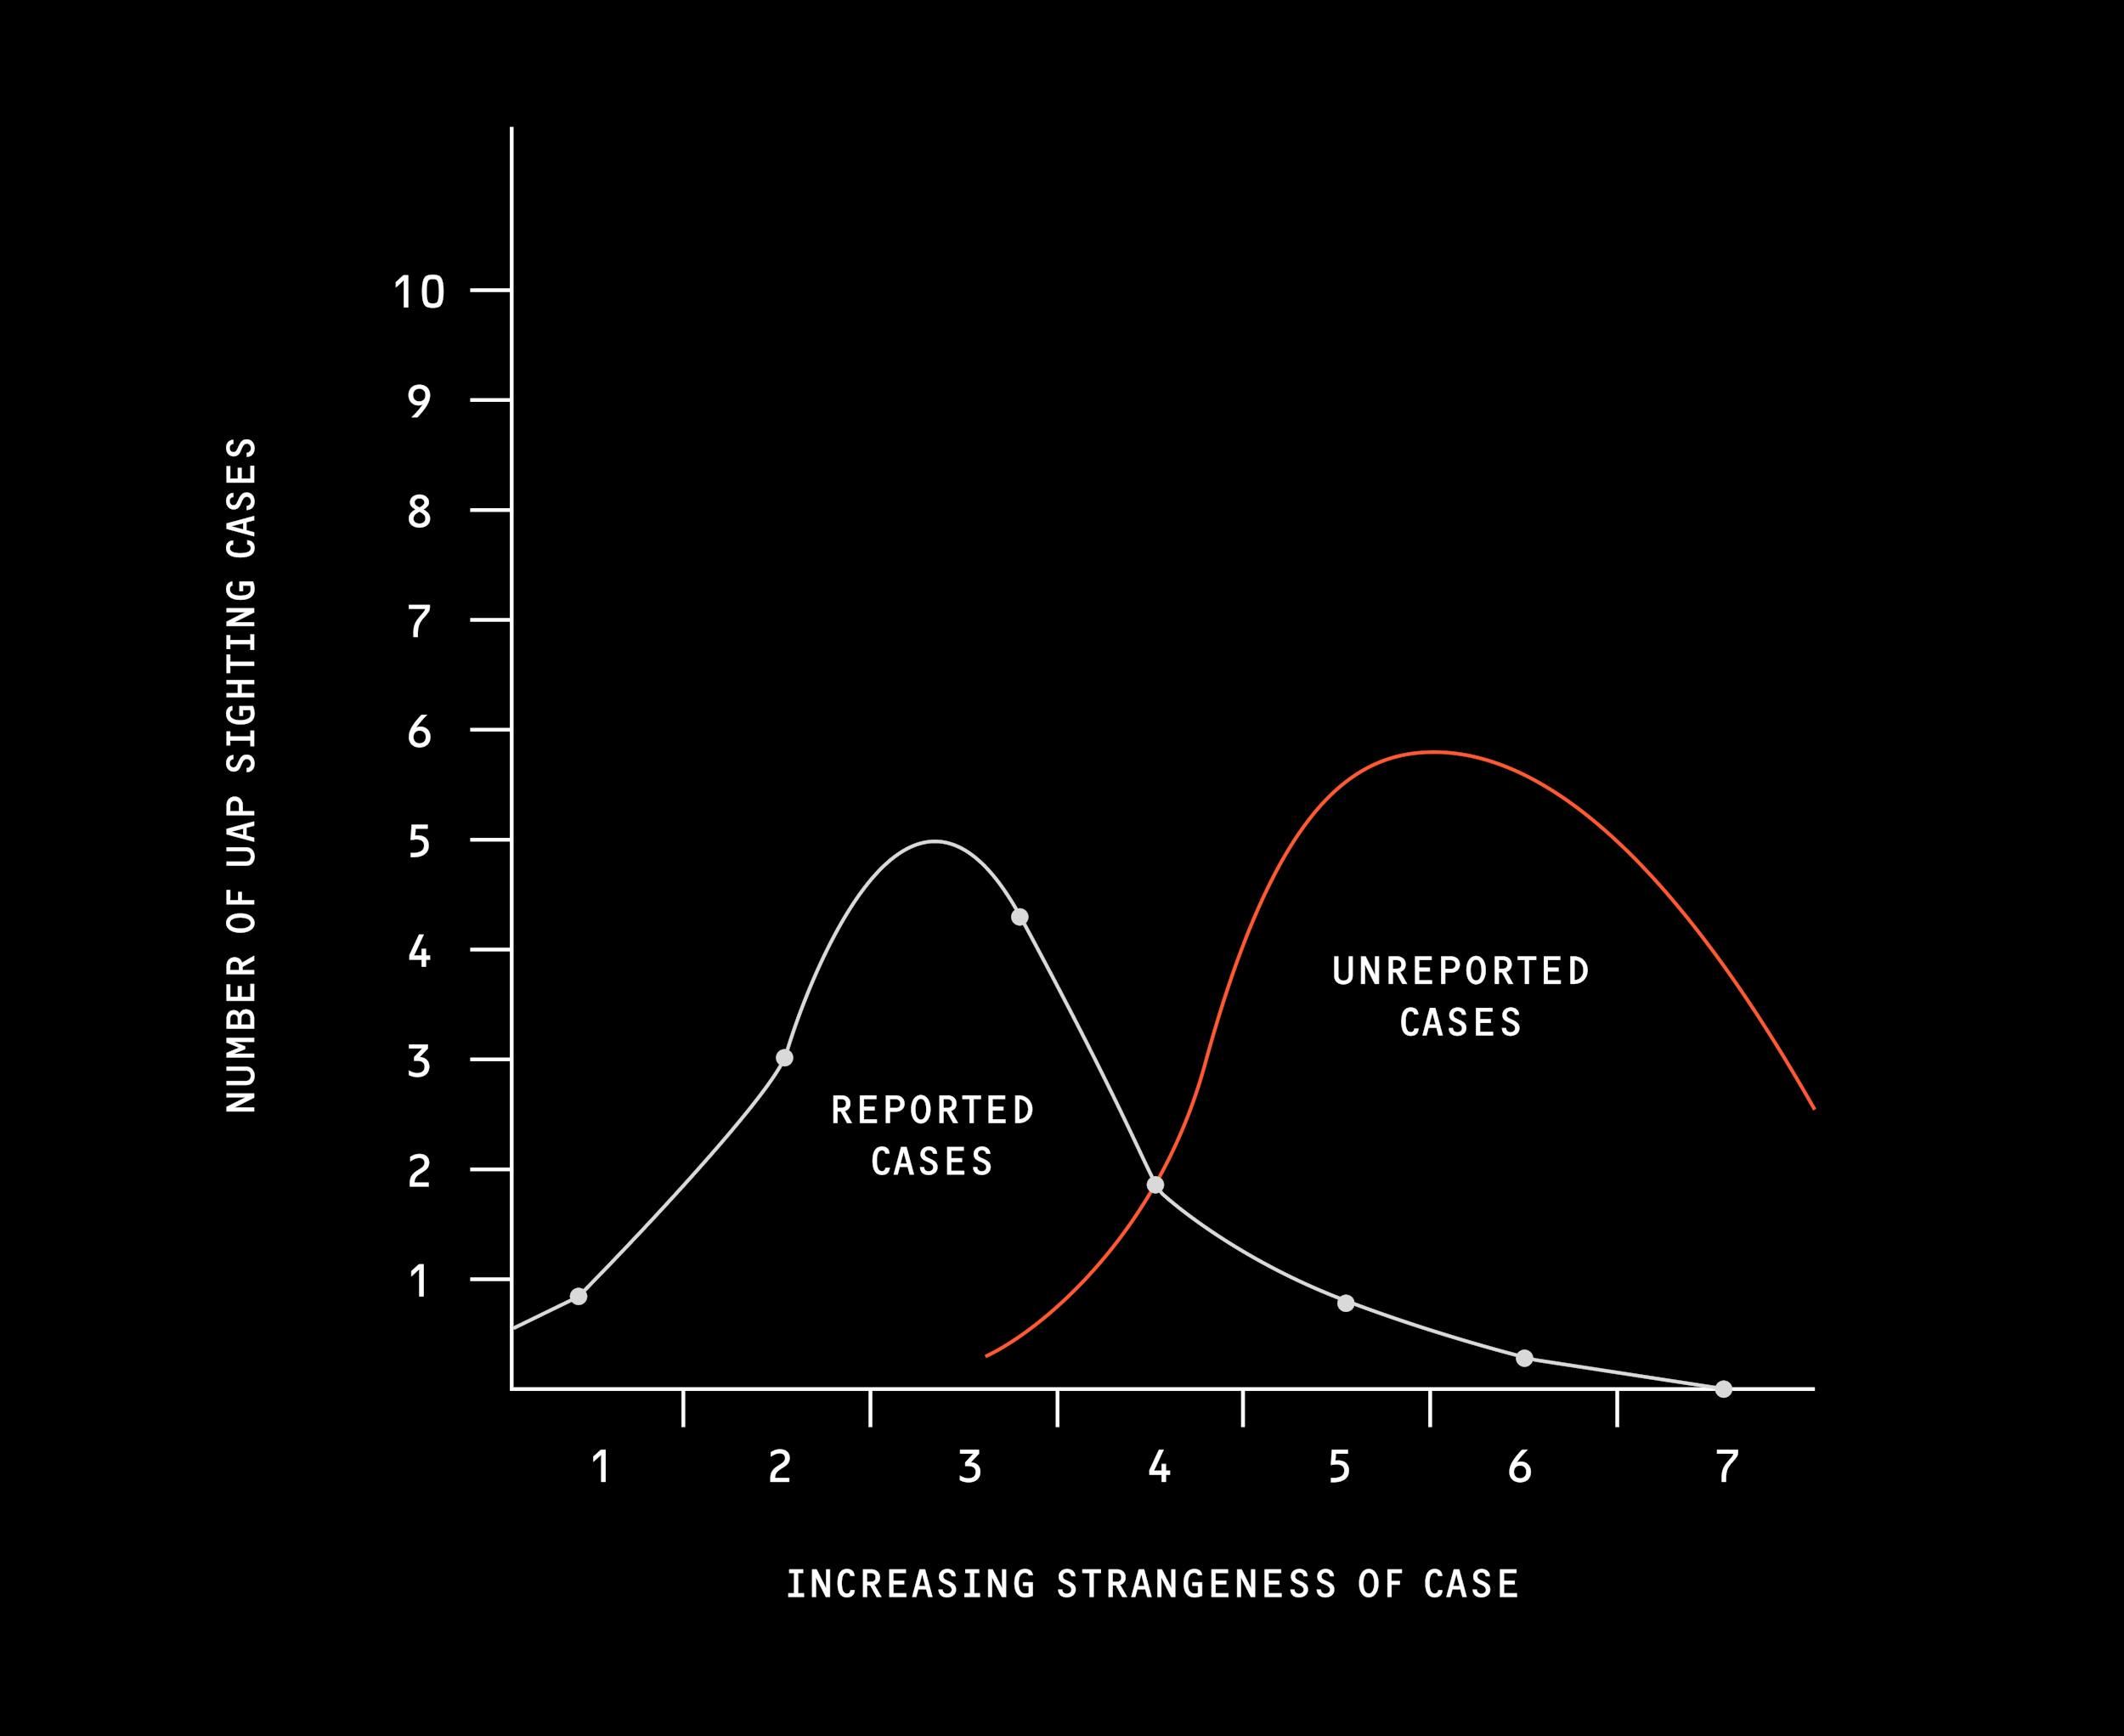
Source: Jacques Vallée
Here at Enigma, our anecdotal experience lines up with Vallée's theory. Many users we've spoken to say they've submitted more “casual” sightings, but not necessarily the stranger, more intense or personal experiences. As Enigma ramps up coverage, reaches more people, and as the flywheel of sharing experiences expands and people hear each others' stories, we expect the stranger and more anomalous sightings reports to go up as a percentage of the total.
Rate of sightings data collection
It is important to place all this analysis in proper context. Enigma just got up and running this year and just started taking in submissions via our app in May. We still have much to learn about how best to serve people, but we are proud of the trajectory so far. It took us 11 months, from February to December 2023, to cross the first 12,000 sightings submitted:
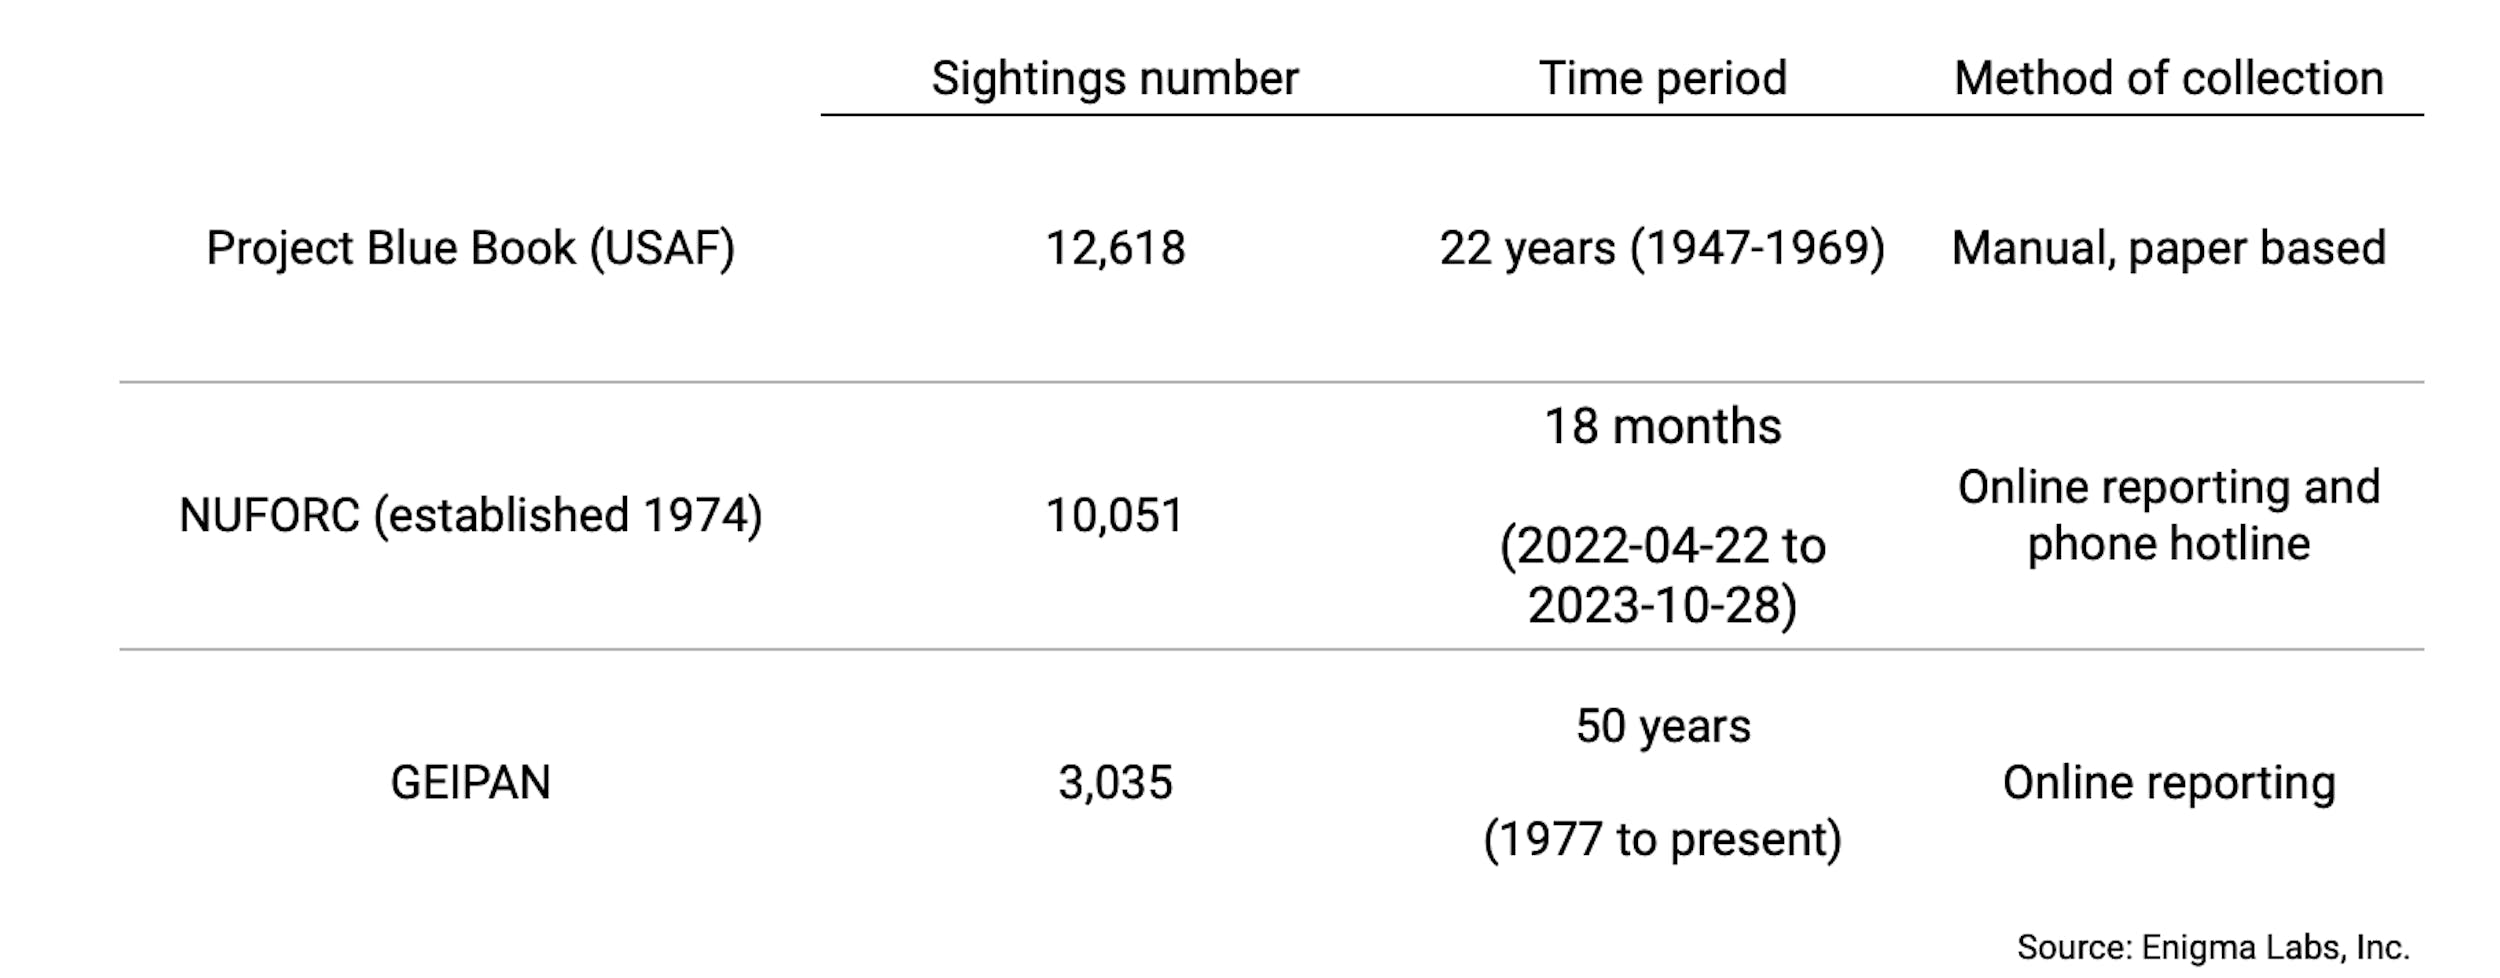
Collecting sightings is challenging and time consuming. Comparisons with historical efforts demonstrate that Enigma's collection of sightings has been comparatively fast. Other groups have made valiant efforts over many years to collect reports. Despite being seriously resourced and credentialed (Project Blue Book was run by the US Air Force) or being a long-established organization (the volunteer project NUFORC was set up in 1974) it took them a lot of time to cross 12k sightings:
Enigma is made up of technologists, so building is in our DNA, and we fundamentally believe that just as technology has made our daily lives easier and more efficient, it can also help accelerate progress in the UAP sightings realm. By leveraging technology and by being obsessed with customer service, we can accelerate the sharing of sighting stories and scale coverage of what's anomalous in the skies.
Our team hails from a wide range of backgrounds across data science, mapping, and consumer apps – places including Foursquare, Dropbox, Snap, Mapbox, Instagram, Tumblr, AWS, Apple, Nike, Amazon, Samsung and Google. Although we are just a small startup and constantly have to consider resource tradeoffs, this background and training means our team is obsessed with iterating, improving, and listening to our community's needs.
As we hit the 12,000 submission milestone, we are proud of what we have built and remain committed to improving our platform. As we think about the year ahead there's a lot of exciting things to come. To name just a few:
- Android app: sign up for the waitlist!
- More known object data layers in our AR lens for identification
- Multiple phone triangulation of objects
- Machine learning and computer vision on objects in users' videos
Thanks for your support and for following our journey. Here's to a happy, healthy 2024 — and the next 12,000 UAP sightings!